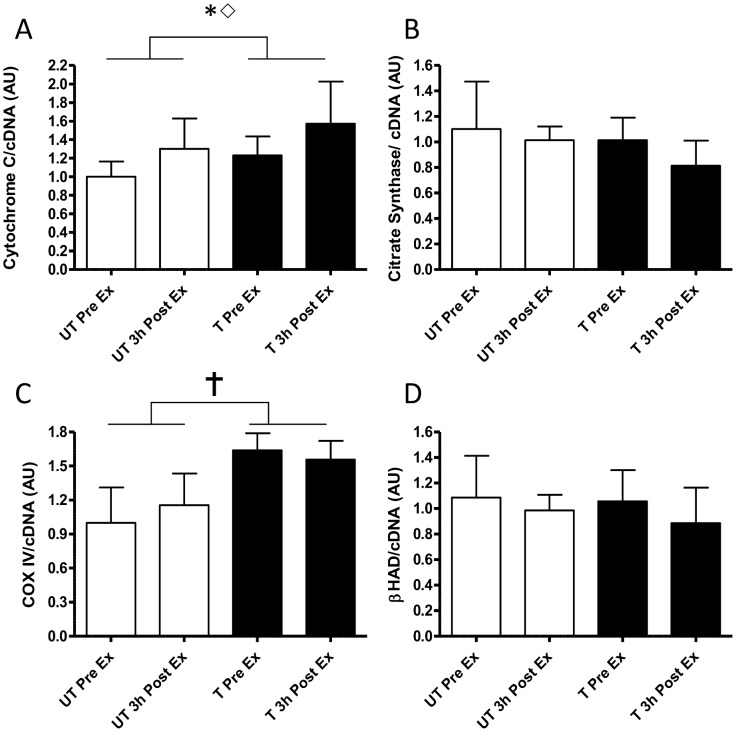
Figure 3. Changes in normalised gene expression of representative mitochondrial proteins in response to the same 1 h cycling bout (∼164W or ∼72% VO2peak) before and after 10-d of intensified cycle training.
A-,electron transport system protein cytochrome c, B- β-Hydroxyacyl CoA Dehydrogenase (β-HAD), C-cytochrome c oxidase subunit IV (COXIV) and D- citrate synthase. Data are mean ±SD for n = 9. pre-training exercise bout (open bars); post-training exercise bout (closed bars); Pre Ex-resting sample just prior to exercise. 3 h Post Ex -sample take 3 h after exercise;  - main effect of training P<0.001; * - main effect of training P<0.05; ⋄-main effect of time P<0.05.

