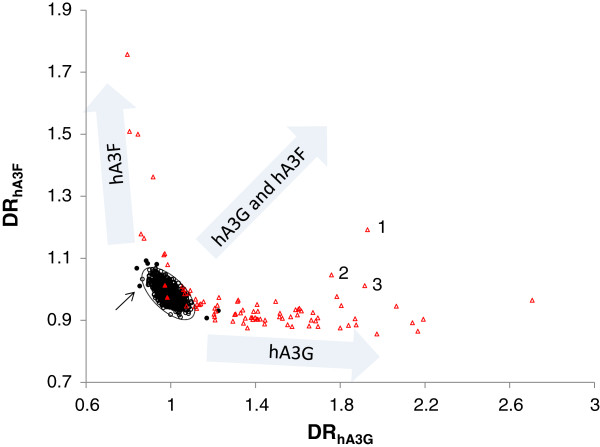
Figure 2.
The plot of DRhA3Gversus DRhA3F of 2917 full genome (>7000 n.t.) HIV-1 sequences. The sequences identified as normal and hypermutated by LANL are shown using black circles and red triangles, respectively. The seven nominally normal sequences with α >> 99.9% (appear outside the 99.9% confidence interval broken line) are shown by filled circles. The two nominally hypermutated sequences with α < 50% are shown by filled triangles. The sequences hypermutated by hA3G appear along the horizontal axis and those affected by hA3F extend along the vertical axis. The sequences co-mutated by hA3G and hA3F locate between these two groups.

