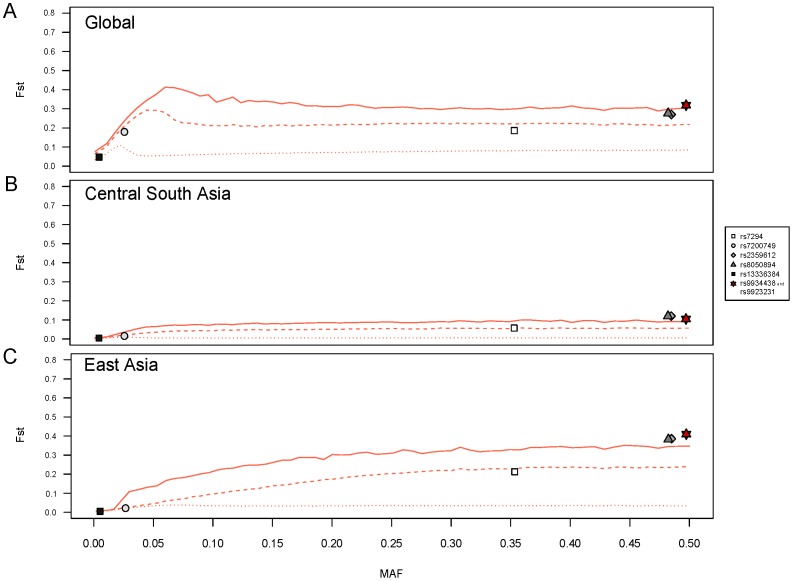
Figure 2. Atypical patterns of genetic differentiation observed for VKORC1 SNPs.
Genome-wide empirical distributions of FST values were constructed from 644,143 SNPs having a MAF ≥0.001 at the global level. Individual values of FST calculated for each of the seven VKORC1 SNPs are plotted against their global MAF. The functional rs9923231 SNP is shown in red. The 50th, 95th and 99th percentiles are indicated as dotted, dashed and full red lines, respectively.

