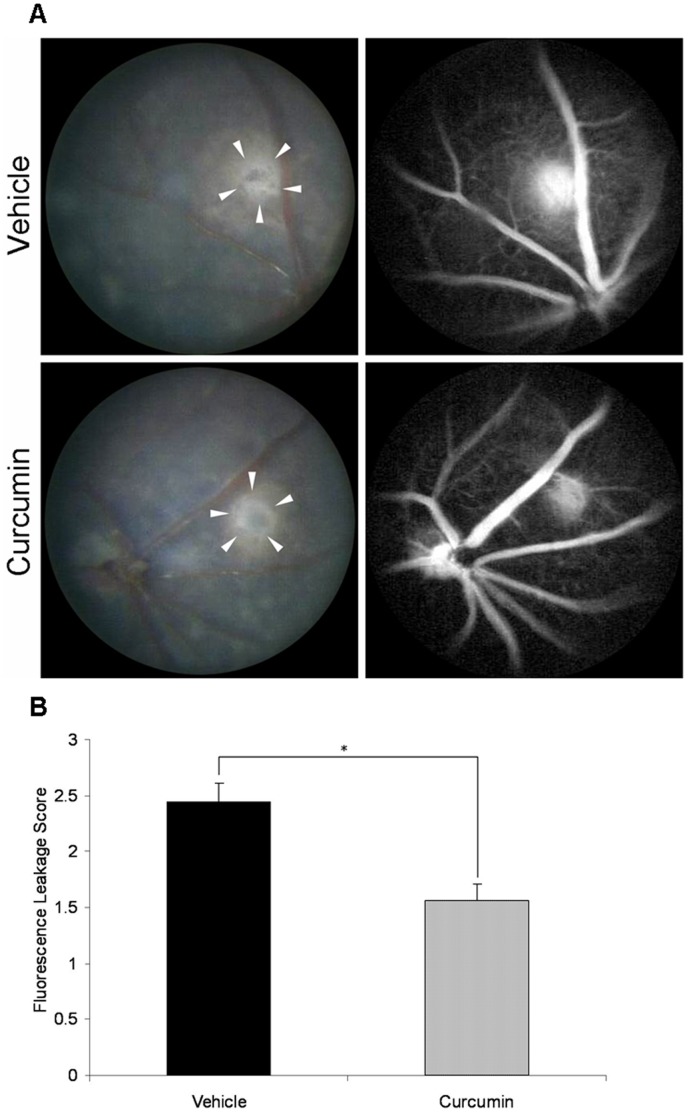
Figure 2. Fluorescein angiography (FA) of CNV lesions.
(A) Representative images of fundus and late-phase FA of vehicle-treated and curcumin-treated mice on day 14 after laser photocoagulation (white arrowheads: laser spots). (B) Comparison of semi-quantitative CNV FA score between vehicle- and curcumin-treated mice (n = 18 spots, *P<0.001).

