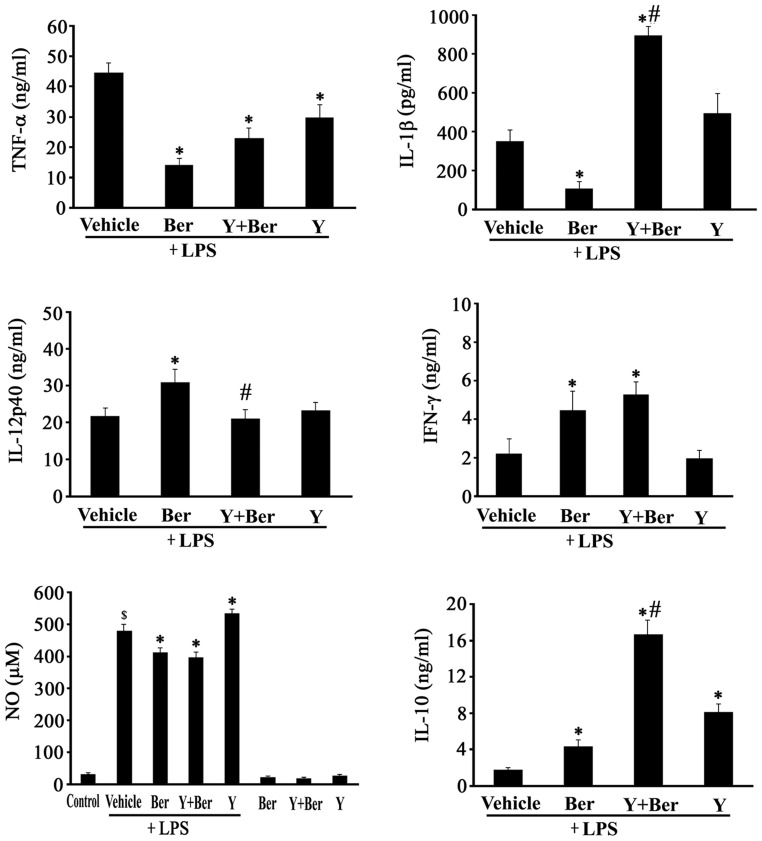
Figure 4. Effects of Ber or/and Y on plasma cytokine and NO levels in LPS-treated mice.
TNF-α, IL-1β and IL-10 were measured at 2 h, IL-12p40 and IFN-γ were detected at 4 h, and NO at 8 h after LPS or normal saline injection. n = 8−10. $ P<0.05 compared with control, *P<0.01 compared with LPS group, # P<0.01 compared with Ber+LPS group or Y+LPS group.

