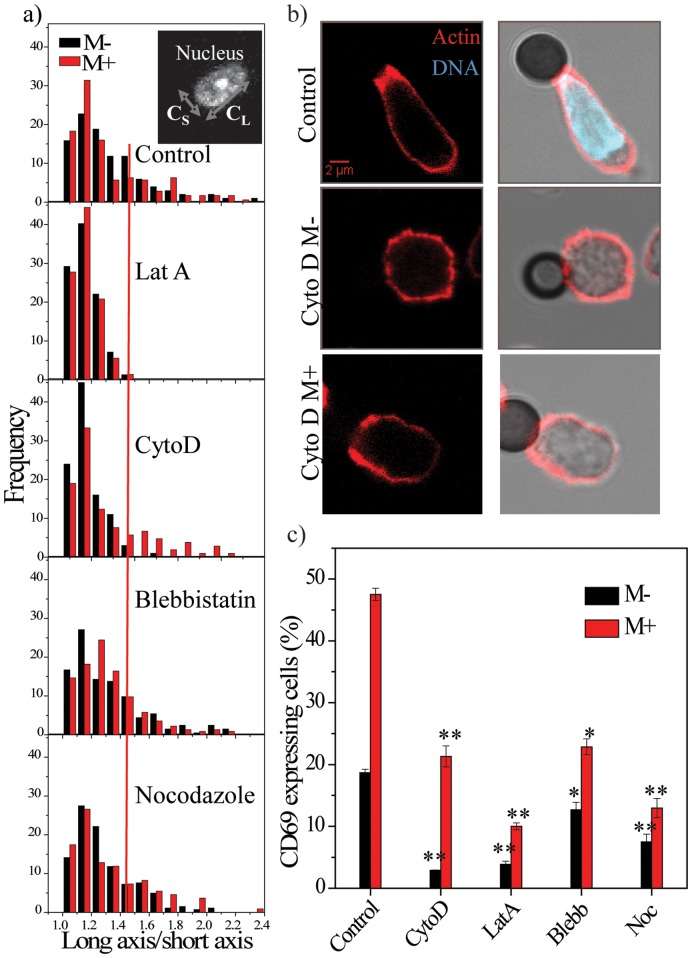
Figure 3. Nuclear elongation is dependent on actin remodeling.
a) Normalized histogram showing CL/CS values in activated T-cells in M− and M+ conditions in control or after treatment with various inhibitors (n = 200). The red line is used as a cut-off that marks round cells. Inset shows image of a nucleus depicting CL/CS. b) Actin, DNA and bright-field images for control and cytochalasin D (cytoD) treated M− and M+ cells. In the bright-field image, black represents the antibody-coated beads. Scale bar 2 µm. c) Fraction of cells positive for CD69 in control or cells treated with cytoskeletal inhibitors. *p<0.05, **p<0.005. Statistical significance is calculated with respect to control samples (M− or M+).

