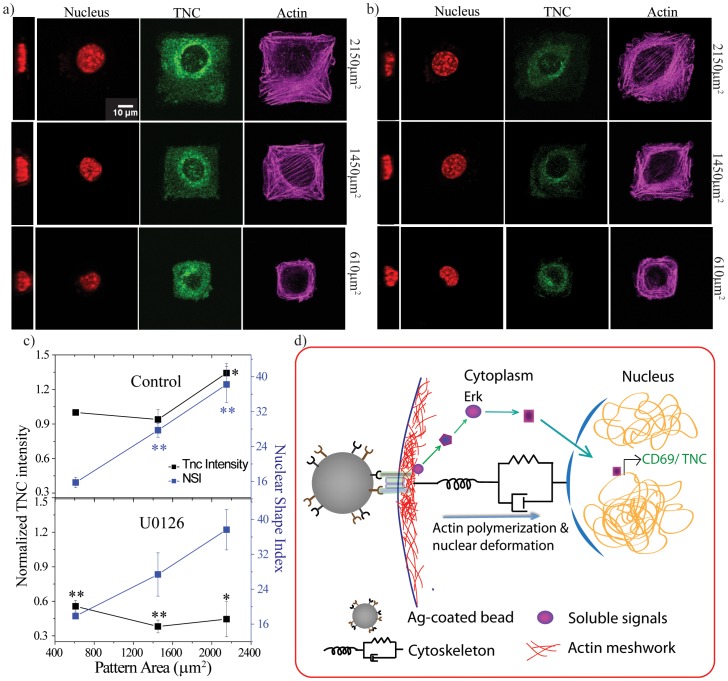
Figure 5. Nuclear deformation and gene expression by modulating cell geometry.
Staining for nucleus, TNC and actin in control (a) and Erk inhibitor (b) treated cells on squares of different sizes. On extreme left of each panel x-z projection image of nucleus is shown. Scale bar 10 µm. c) Plot of integrated TNC intensity (normalized to smallest square of control for all samples) and NSI values for control (upper panel) and Erk inhibitor (lower panel). N = 3. Statistical significance calculated with respect to smallest square of control. *p<0.03; **p<0.008. d) Schematic representation of signaling preceding CD69 or Tenascin C expression.

