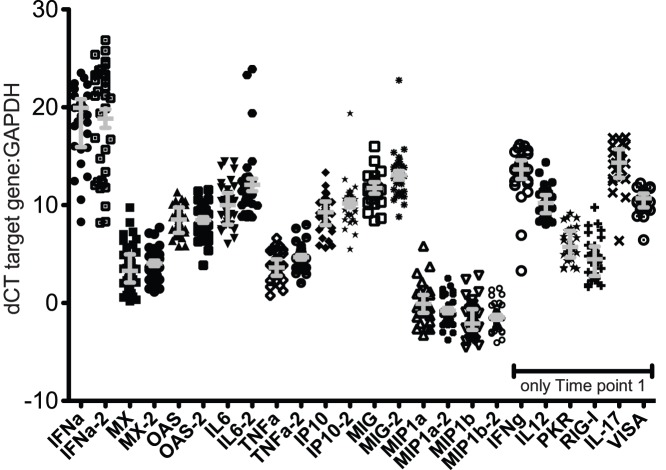
Figure 1. Concentration of all mRNAs (relative to GAPDH) in vaginal secretions collected between menstrual cycle days 10–20 from 36 RM at Time point 1 (March 2011) and from 30–35 RM at Time point 2 (November 2011).
The samples collected at Time point 2 are denoted by the notation “−2”. All vaginal secretions were collected between menstrual cycle days 10–20. Note that there was not enough CVS sample at Time point 2 to assess all mRNA targets that were tested at Time point 1. Grey bars denote median and interquartile range of the values.

