
Figure 7. Network of statistical correlations between inflammatory mediators and microbiota.
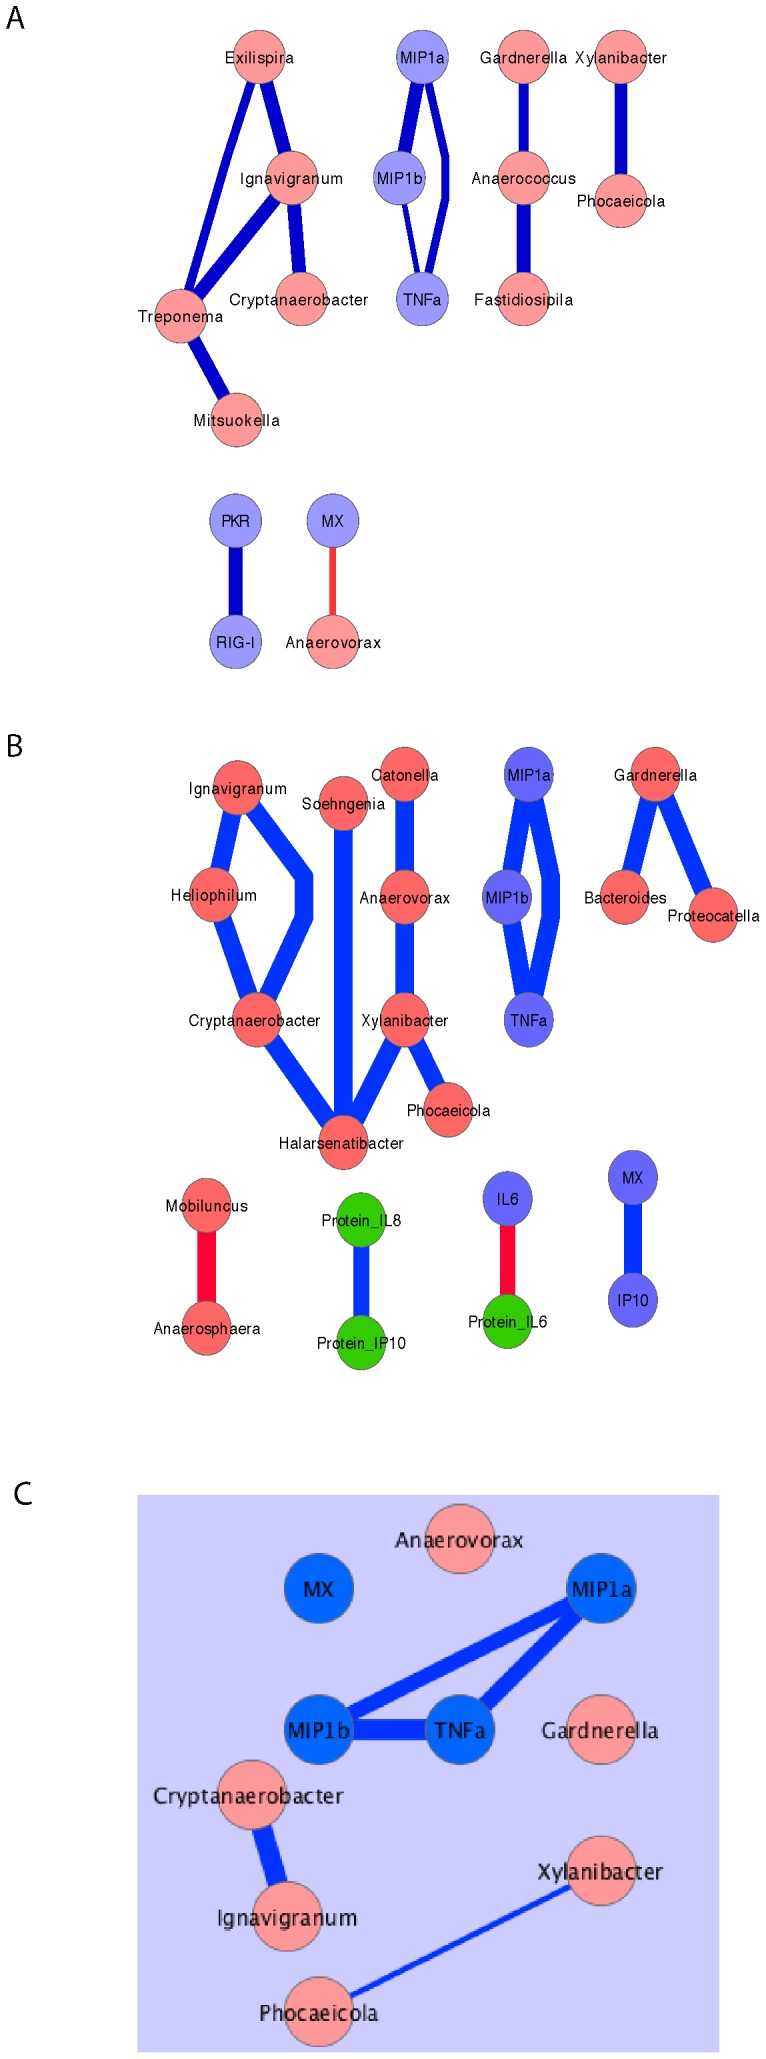
After unbiased analysis of potential associations between host gene mRNA levels and bacterial DNA levels using a Spearman’s correlation function there was a limited network of strong (>0.7) correlations between chemokines/cytokines and microbiota A) at time point 1; B) at time point 2. C) Intersection of strong correlations that existed at both Time 1 and Time 2. Blue circles, host gene mRNA levels, green circles host protein levels, pink circles bacterial DNA levels. The blue lines indicate a positive correlation between the parameters in the circles and the width of the line is proportional to the strength of the correlation. The red lines indicate a negative correlation between the parameters in the circles and the width of the line is proportional to the strength of the correlation.