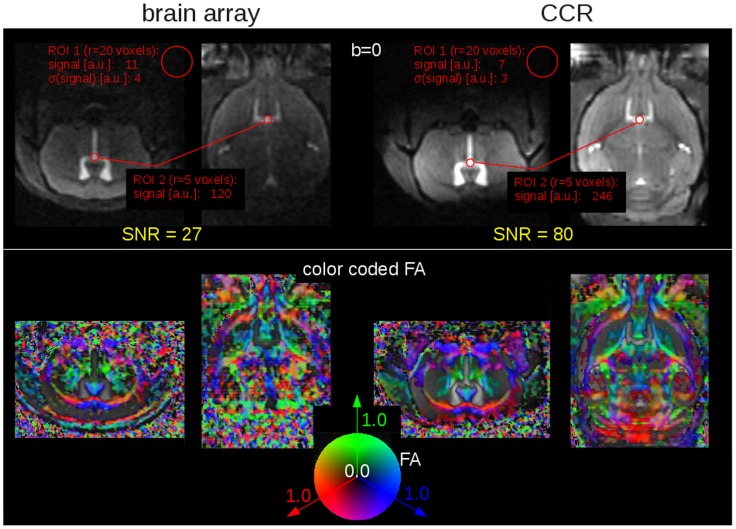
Figure 1. Brain array coil (left) vs. cryogenic cooled resonator (CCR – right).
Upper panel: (b = 0) anatomical images (axial slice and coronal reconstruction) used for signal-to-noise ratio (SNR) estimation: ROI 1 (r = 20 voxels) is located in a region without signal in order to estimate the noise, ROI 2 (r = 5 mm) is located in the ventricles in order to estimate the signal intensity in a region with high (b = 0)-signal. Lower panel: Directional encoded color maps of FA (axial slice and coronal reconstruction) - directional information was incorporated by color coding the scalar FA map with the red, green and blue colors to label the left-right, ventral-dorsal, and caudal-rostral directions, respectively.

