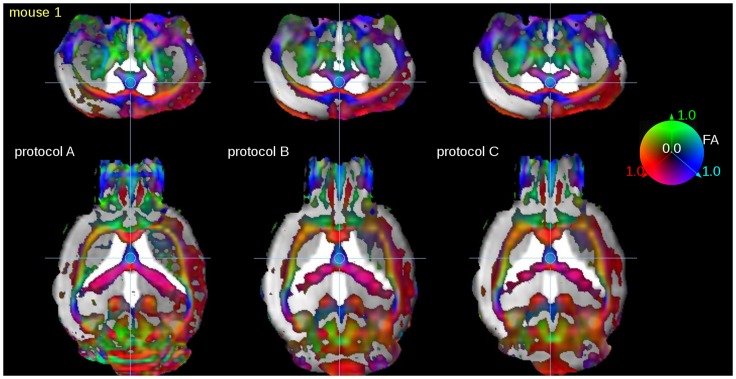
Figure 2. Directional encoded color maps of FA overlaid into (b = 0) anatomical images: comparison of FA quality for scanning protocols (SPs) A (35 minutes, 1 average), B (110 minutes, 6 averages), and C (18 minutes, 1 average).
Coronal slices (upper panel) show only slight visual differences. The lower slice thickness of SP A (compared to SPs B and C) is visible in the reconstructed axial slices (lower panel). Directional information was incorporated by color coding the scalar FA map with the red, green and blue colors to label the left-right, ventral-dorsal, and caudal-rostral directions, respectively. FA-display threshold was 0.2.

