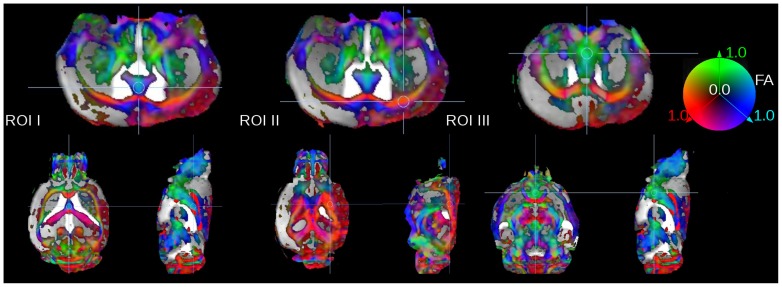
Figure 3. Location of ROIs for FA-value calculation in the septohippocampal nucleus (ROI I), in the corpus callosum (ROI II), and in the medial septal nucleus (ROI III).
Directional information was incorporated by color coding the scalar FA map with the red, green and blue colors to label the left-right, ventral-dorsal, and caudal-rostral directions, respectively. FA-display threshold was 0.2.

