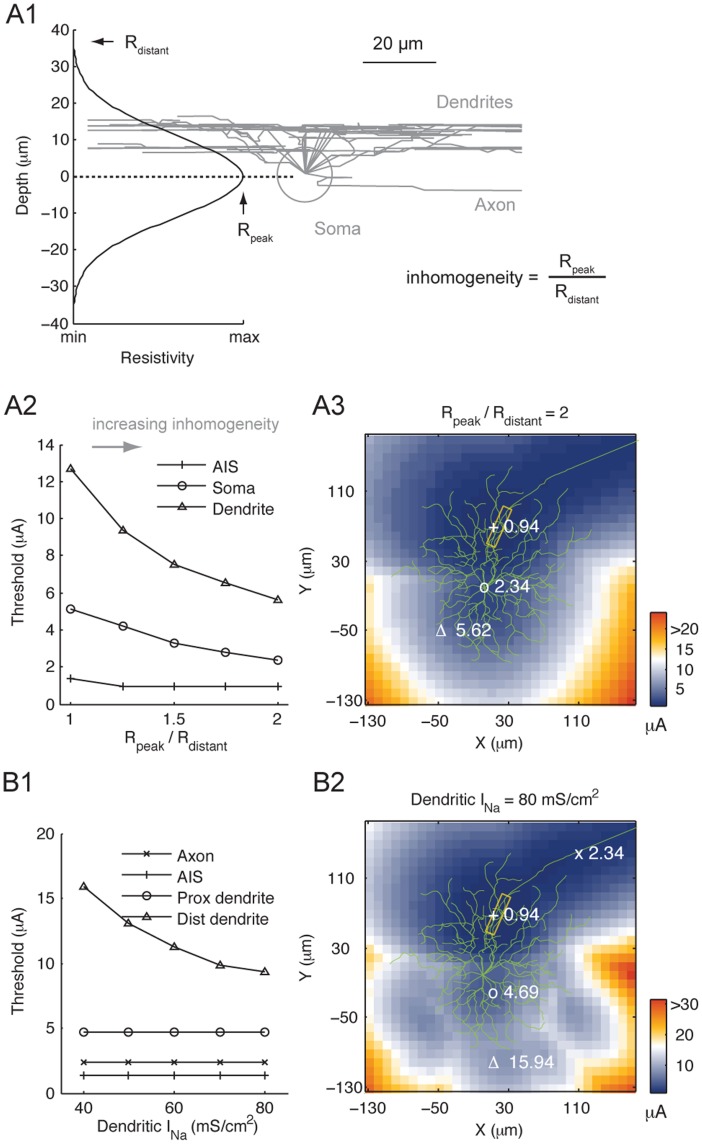
Figure 2. The influences of tissue resistance inhomogeneity and dendritic excitability on RGC threshold.
The stimulation electrode had 10 µm radius. (A1) Variation of tissue resistivity as a function of retinal depth. Peak resistivity occurred at the center of RGC somatic layer. (A2) Threshold variation of cellular locations, marked in (A3), with increasing tissue resistance inhomogeneity. (A3) Threshold map for the Off RGC when the maximum (Rpeak) and minimum (Rdistant) resistivity differed by a factor of 2. Number next to the symbols (+, o and Δ) designates threshold (in µA) at the marked location. The shape of the threshold map is comparable to those with homogeneous tissue. In particular, the AIS (boxed region) continued to have the lowest threshold. (B1) Increasing dendritic INa reduced the threshold of distal dendrites, but had little effect on the threshold of other cellular components. The default conductance used in this study is 40 mS/cm2. (B2) Threshold map of the Off RGC with 80 mS/cm2 dendritic INa (twice the value used throughout this study).

