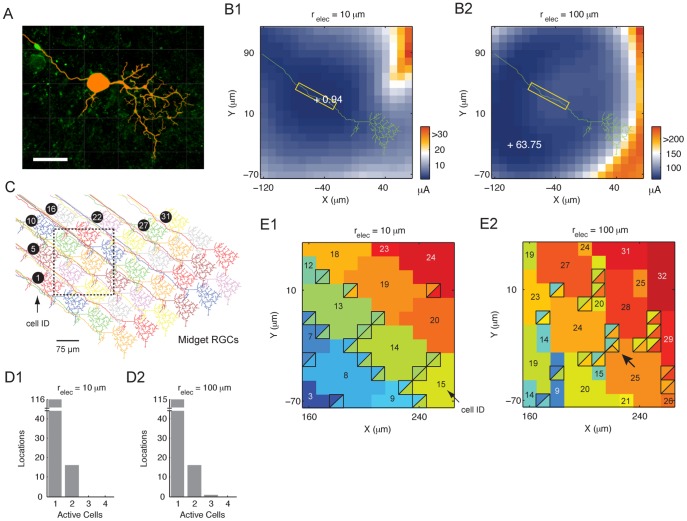
Figure 8. Responses of midget RGCs as a single-cell and as a cluster.
(A) Traced midget cell volume overlaid on original confocal fluorescent image. Scale bar, 20 µm. (B1 and B2) Threshold map of the model midget RGC with small (10µm; B1) and large (100 µm; B2) stimulating electrodes. Number next to each+symbol is the threshold at the marked location. Boxed region, AIS. (C) A mosaic of 33 midget RGCs, with each cell uniquely identified by an ID. The boxed area indicates the test region. (D1 and D2) Histogram for the number of active cells with the small (D1) and large (D2) electrode. (E1 and E2) Identity map of activated cells following threshold stimulation in the test region for the small (E1) and large (E2) electrode. The square boxes denote places with multi-cell activation. The colors in the box designate the identity of the activated cells. The number in each color patch is the activated cell’s ID. Arrow, location with three activated cells.

