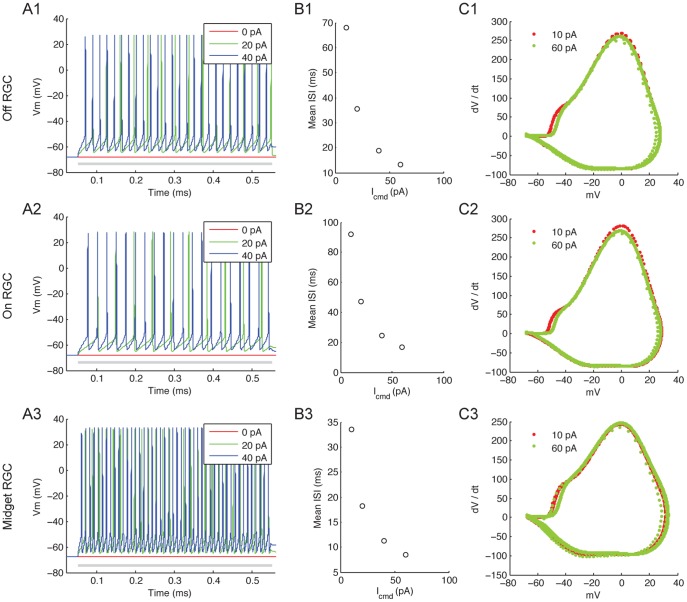
Figure 9. RGC responses evoked by intracellular current injection.
All intracellular current pulses were applied for 500 ms. (A1∼A3) Vm responses of the Off, On and Midget RGC to 0, 20 and 40 pA depolarizing current. Gray bar, duration of current injection. (B1∼B3) Mean inter-spike intervals during depolarizing current injection. (C1∼C3) Response phase portrait for 10 and 60 pA current injection.

