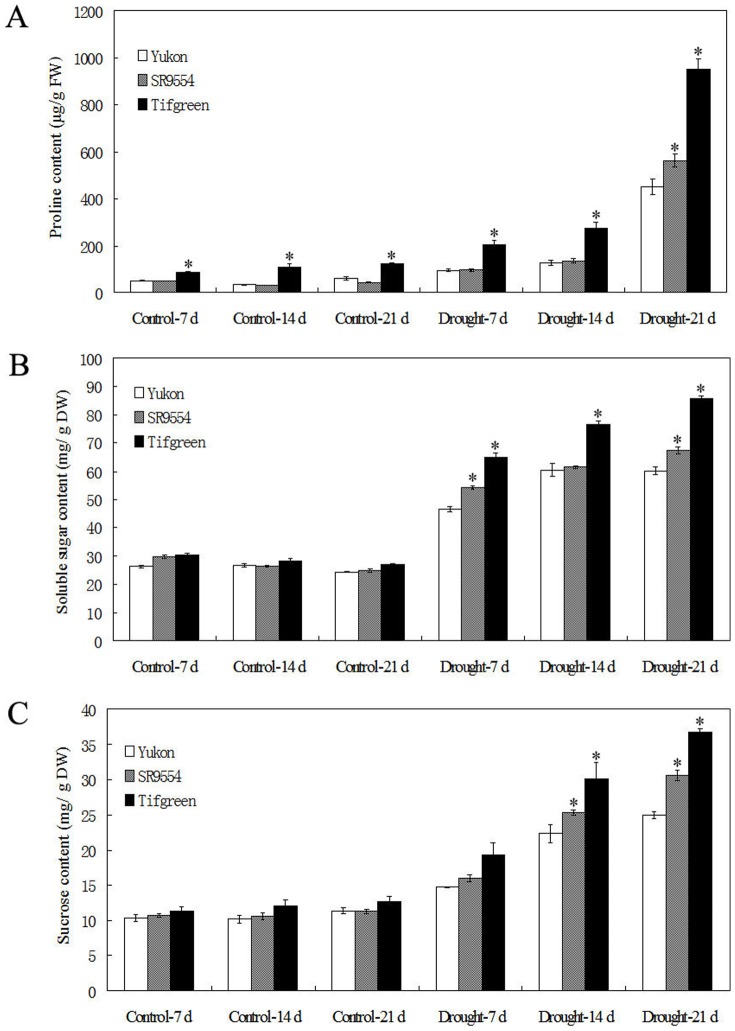
Figure 5. Accumulation of osmolytes of three bermudagrass varieties differing in drought tolerance during drought stress.
Changes of proline content (A), soluble sugars (B) and sucrose content (C) of three genotypes of bermudagrass during drought stress were shown here. The results shown are mean ± SE (n = 4). Asterisk symbols indicate significant differences from Yukon (P<0.05).

