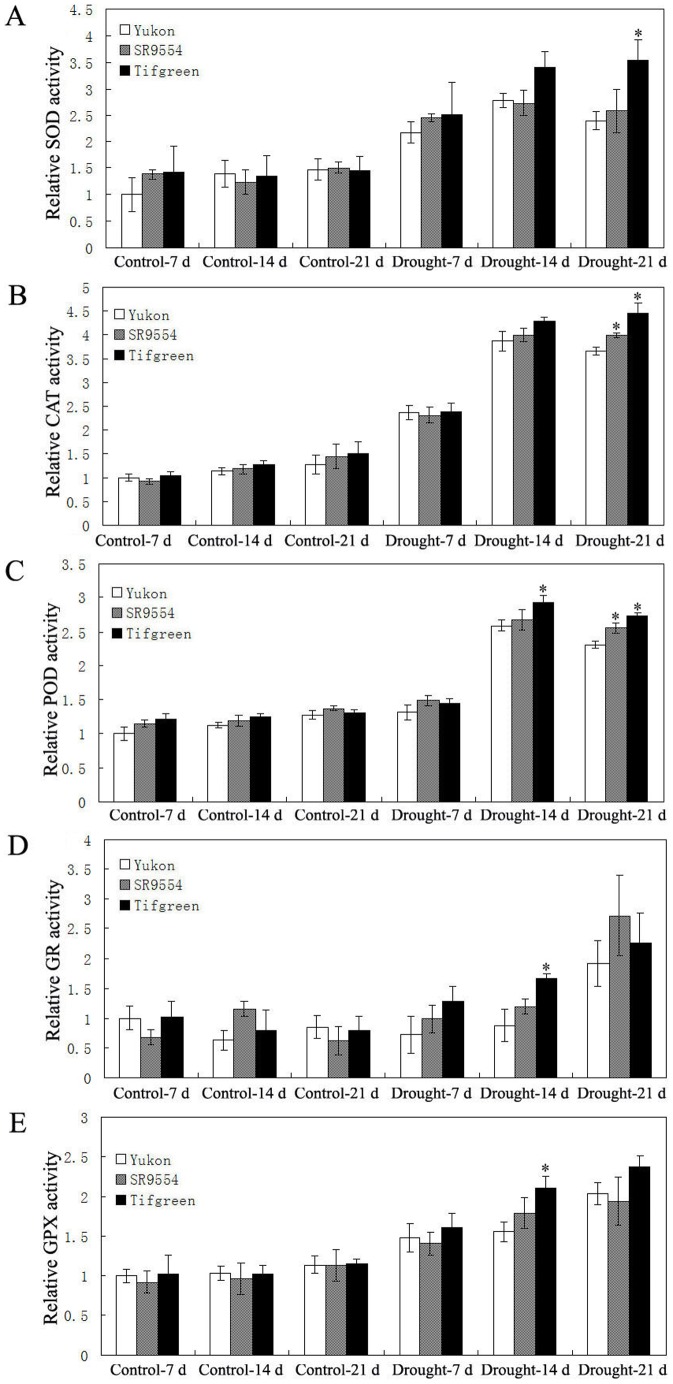
Figure 7. Antioxidant enzyme activities of three bermudagrass varieties differing in drought tolerance during drought stress.
(A)–(E) Comparisons of SOD (A), CAT (B), POD (C), GR (D) and GPX (E) activities three represent drought tolerant, moderately tolerant and susceptible accessions under control condition and drought stress were shown here. The relative activities were quantified as fold change in comparison with Yukon under control conditions for 7 d. The results shown are mean ± SE (n = 4). Asterisk symbols indicate significant differences between Yukon and other genotypes (P<0.05).

