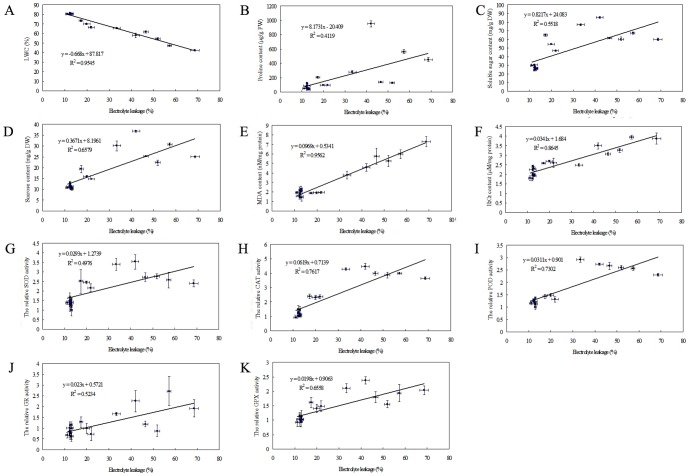
Figure 8. Correlations analysis of EL with other parameters during drought stress.
(A)–(I) The linear correlation of EL with LWC (A), MDA content (B), Proline content (C), soluble sugars (D), sucrose content (E), H2O2 content (F), SOD activity (G), CAT activity (H), POD activity (I), GR activity (J) and GPX activity (K) of three represent cultivars (Yukon, SR9554 and Tifgreen) during drought stress. The results shown are mean ± SE (n≥4).

