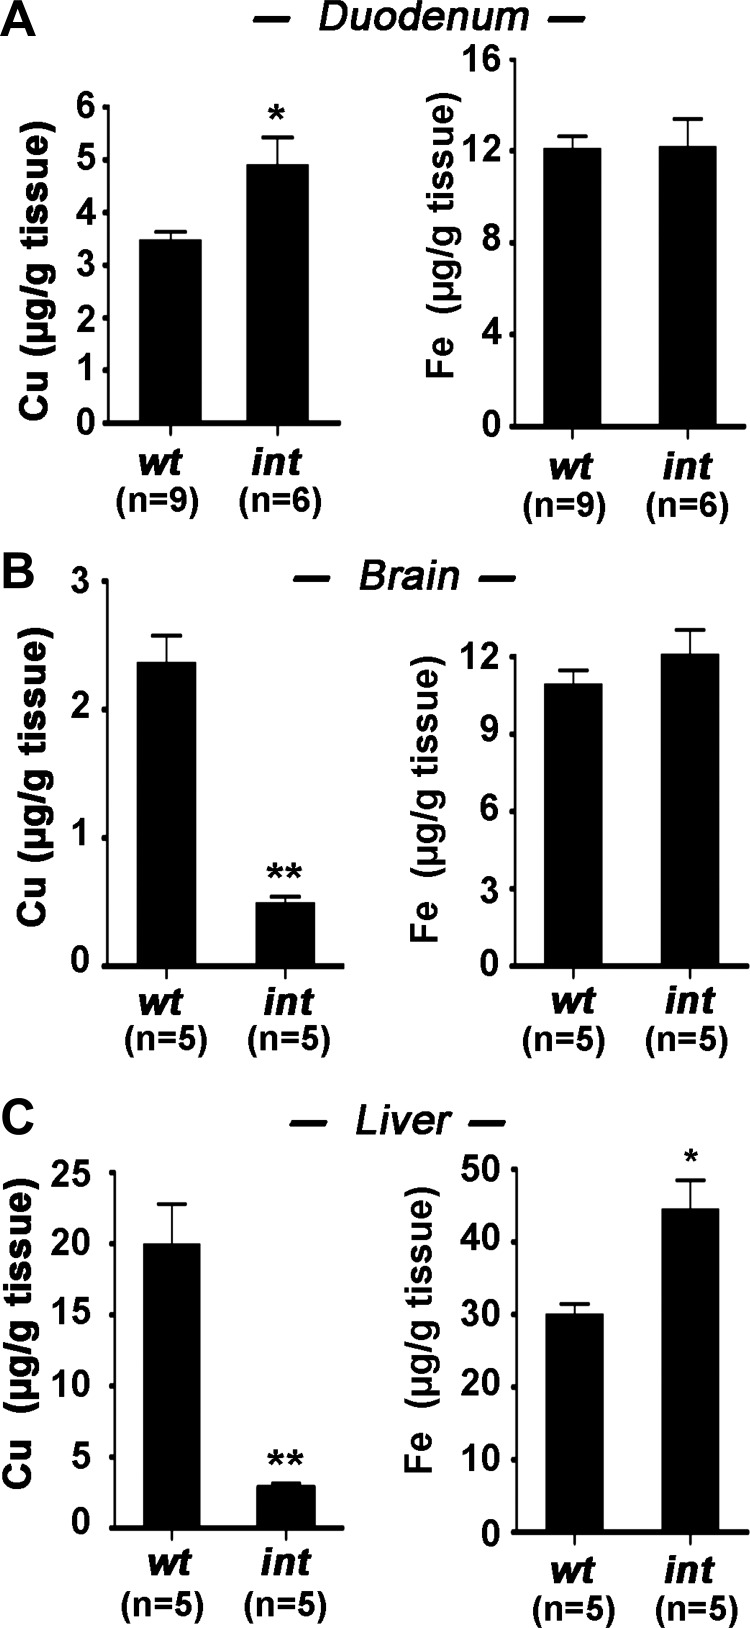
Fig. 3.
Copper and iron concentrations in different tissues. Copper and iron was measured in small intestine (duodenum) (A), brain (B), and liver (C) of Atp7awt/Y (wt) and Atp7aint/Y (int) mice at day P16 using atomic absorption spectroscopy. Mean values are expressed as micrograms metal per gram of wet tissue weight ± SE. *P < 0.05, **P < 0.01. All Atp7aint/Y mice were exhibiting symptoms of copper deficiency.

