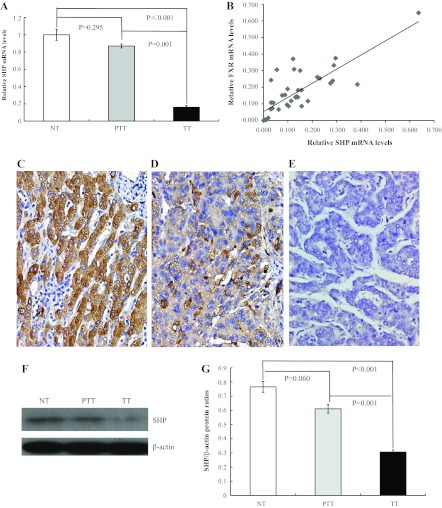
Fig. 2.
Correlation of FXR expression with small heterodimer protein (SHP) in HCC. A: quantitative real-time PCR analysis of SHP mRNA levels in normal liver tissue, peritumoral liver tissue, and HCC liver samples. B: in HCC samples, a significant and positive correlation of FXR and SHP expression was found by the Pearson correlation coefficient test (P < 0.001). C–E: immunoreactivity of SHP in peritumoral tissues (C) was higher compared with that in HCC (D); the negative control is shown in E. Magnification: ×400. F: representative image of SHP protein expression by Western blot analysis. G: quantification of the Western blot results.

