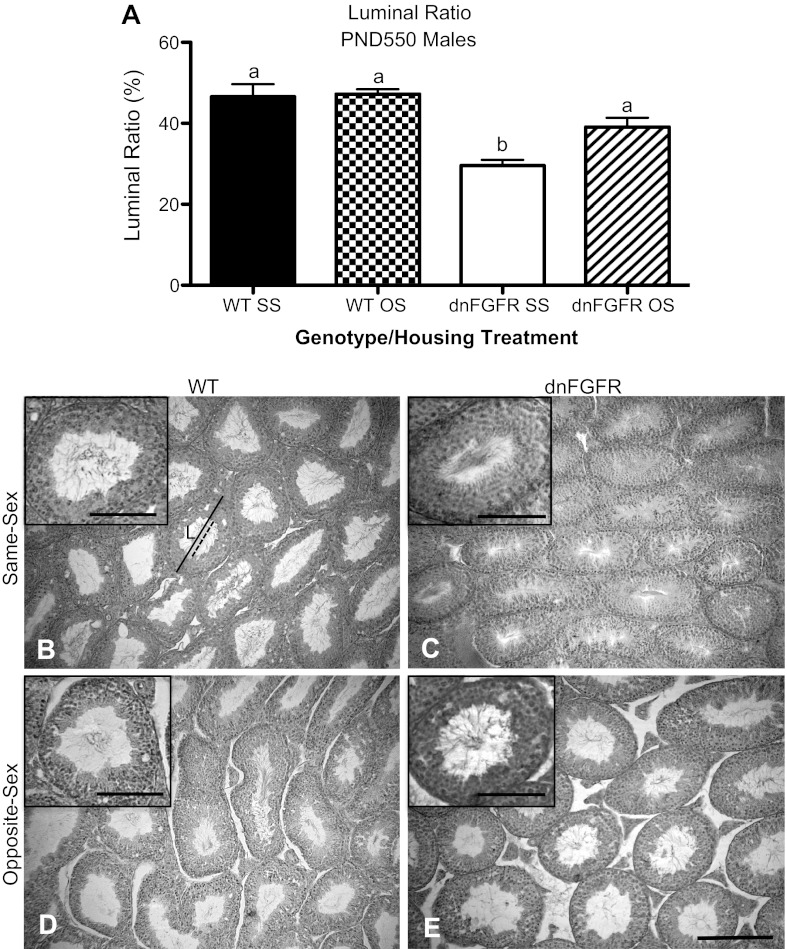
Fig. 5.
Seminiferous tubule (ST) luminal ratio in OS- and SS-housed WT and dnFGFR males at PND550. A: WT and dnFGFR males were SS or OS housed from PND30 to PND550. ST luminal ratio was significantly lower in the SS-housed dnFGFR males compared with the other three groups. Letter differences above bars represent significant differences (P < 0.05, one-way ANOVA followed by Tukey's test; n = 4–5/group). B–E: representative photomicrographs of testicular histology from SS (B and C)- or OS (D and E)-housed WT (B and D) and dnFGFR (C and E) males. Average ST diameter was determined by measuring the widest dimension of randomly selected ST (solid line) and averaging it with the narrowest dimension of the same tubule. Luminal diameters were determined similarly by measuring the lumen (L) of the same ST (dashed line). The ST luminal ratio was calculated as a percentage of the mean ST diameter to mean luminal diameter of the same ST. Scale bar = 200 μm. Representative ST with open lumen are magnified in insets in B–E to show the presence of mature spermatozoa. Scale bars for insets = 100 μm.

