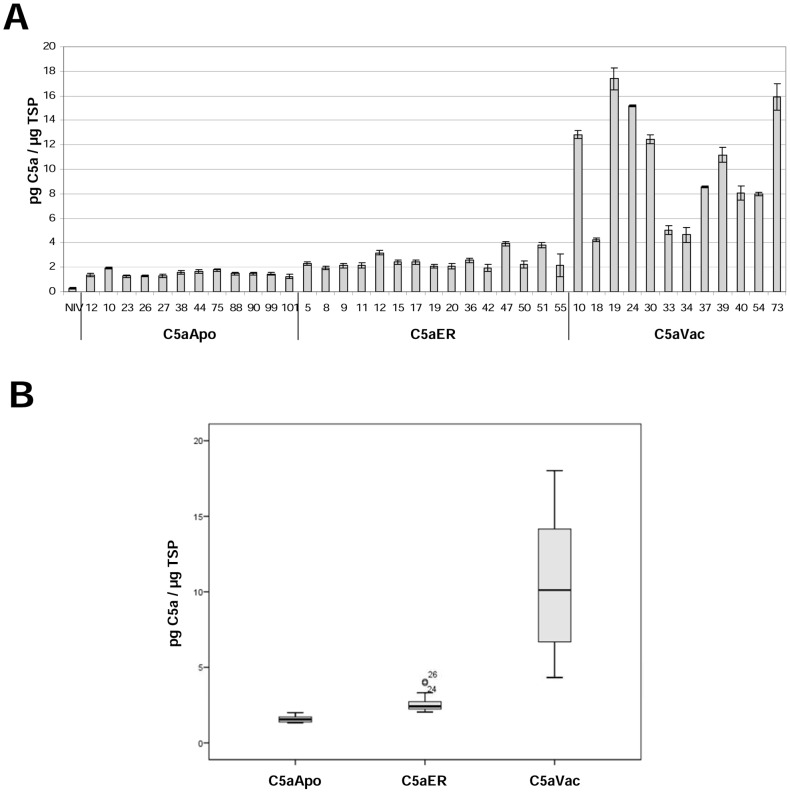
Figure 2. Protein expression levels in leaf extracts from T0 transgenic plants determined using at least two ELISAs.
(A) Expression level measured in the individual transformants; Lane numbers indicate different independent tobacco events (NIV = wild-type control). (B) Box plot representation of C5a accumulation in the leaves of T0 transformants following ANOVA (including the Bonferroni post-hoc test).

