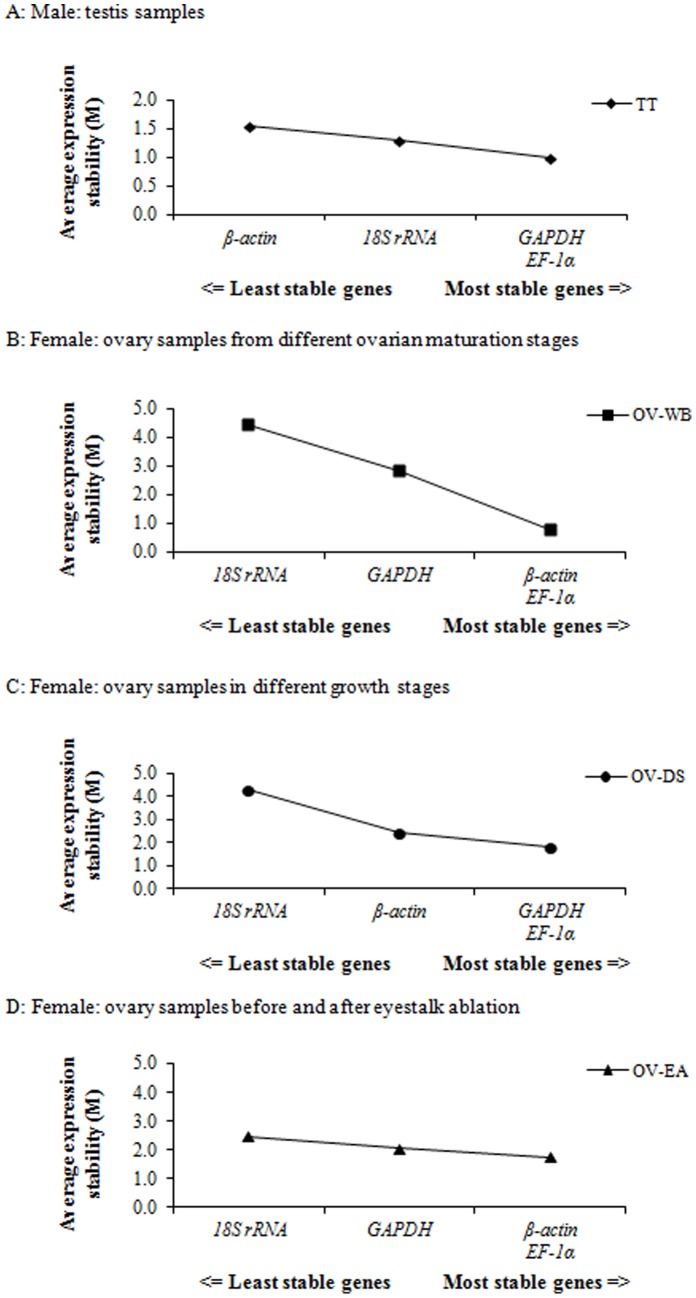
Figure 2. Average expression stability values (M), which is the mean pair-wise variation between an individual gene and all other tested genes, determined by geNorm software.
(A) Average M value of 46 testis samples in P. monodon (TT), (B) Average M value of ovary samples from wild broodstock with different ovarian maturation stages (OV-WB), (C) Average M value of ovary samples from domesticated shrimp with different growth stages (OV-DS) and (D) Average M value of ovary samples from domesticated broodstock before and after eyestalk-ablation (OV-EA) in P. monodon.

