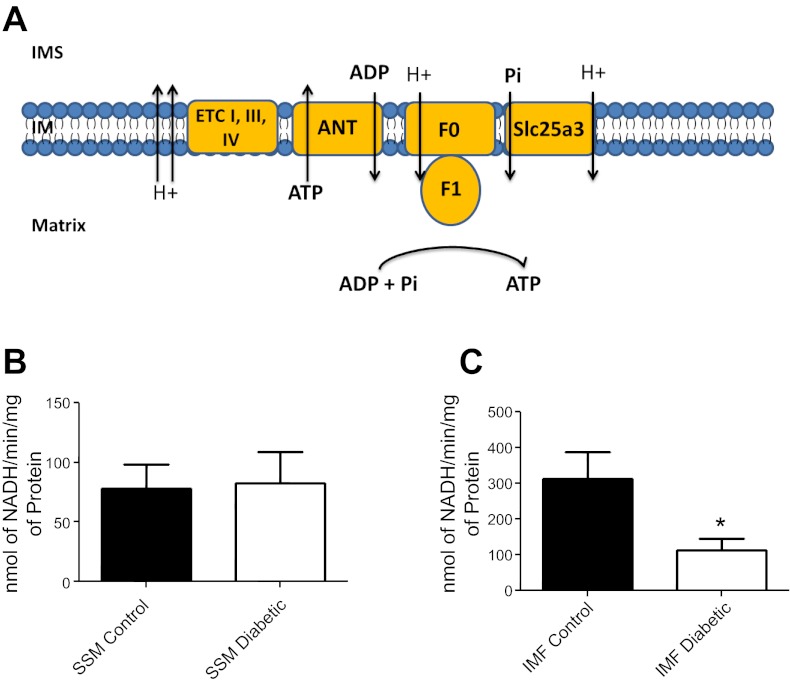
Fig. 6.
Mitochondrial subpopulation ATP synthase activity. A: general schematic of how ATP synthase produces ATP with the aid of Slc25a3 (phosphate transport) and adenine nucleotide transporter (ANT; ADP transport) within the mitochondrion (IM, inner membrane; IMS, inner membrane space; F0 and F1, ATPase subunits). ATP synthase activity was assessed in SSM (B) and IFM (C) from hearts of control and diabetic animals using an assay coupled with pyruvate kinase which converts ADP to ATP and produces pyruvate from phosphoenolpyruvate. Final values are expressed as nanomoles of NADH per minutes per milligrams of protein ± SE; n = 4 for each group. ETC, electron transport chain. *P < 0.05 for IFM diabetic vs. IFM control.

