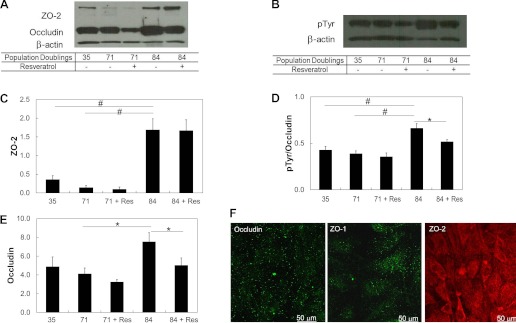
Fig. 7.
Changes in occludin, ZO-2, and phosphorylated occludin with increasing cell age. The increase was mitigated with the addition of 2 μM resveratrol for 48 h. A: Western blot analysis of tight junction proteins probed with antibodies for occludin and ZO-2. B: Western blot analysis of pTyr with control β-actin. C: quantitative analysis of ZO-2. Values are band intensities normalized by the intensity of the β-actin band. D: quantitative analysis of phosphorylated occludin. E: quantitative analysis of occludin. F: immunofluorescence of the tight junction proteins occludin, ZO-1, and ZO-2 in hCB-ECS after 44 population doublings. Data are means ± SE; n = 3. *P < 0.05; #P < 0.01.

