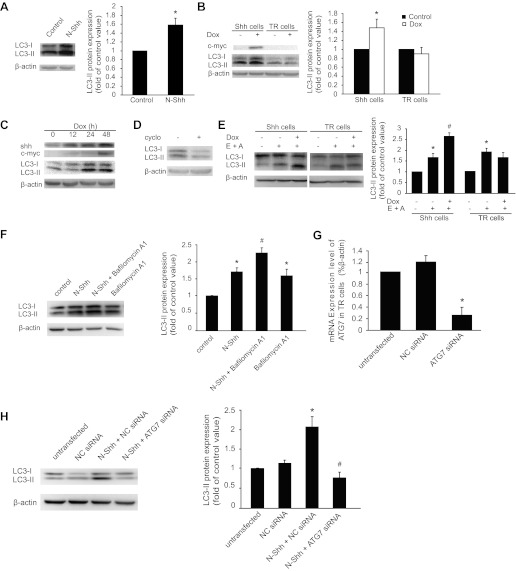
Fig. 2.
Exogenous Shh treatment or Shh induction stimulates LC3-II expression. A: representative Western blots (left) showing the levels of LC3-I and -II protein in mouse aortic smooth muscle cells (SMCs) treated with or without (control) the recombinant amino-terminal peptide of mouse sonic hedgehog (N-Shh). The quantitative results normalized to β-actin are shown in the bar graph (right, *P < 0.01, n = 3). B: Shh expression was induced by addition of doxycycline (Dox) through the inducible tetracycline-regulated expression (T-Rex) system, as described in methods. Human vascular SMCs harboring Shh-T-REx (Shh cells) or tetracycline-repression (TR) cells were treated with or without Dox for 24 h. Representative Western blots (left) showing the expression of Shh (detected with anti-c-myc antibody) and LC3-I and LC3-II. Densitometry of LC3-II Western blot signals was normalized to β-actin in the bar graph (right, *P < 0.05, n = 3). C: representative Western blots showing a time-dependent effect of LC3-I and LC3-II upregulation upon Shh induction. Shh cells were treated with Dox for 0, 12, 24, and 48 h. D: representative Western blots showing the levels of LC3-I and -II in the presence of Shh in response to cyclopamine (cyclo) treatment for 24 h. E: representative Western blots (left) showing the effects of (2S,3S)-trans-epoxysuccinyl-l-leucylamido-3-methylbutane ethyl ester (E64d, E) and pepstatin A (A) treatment (24 h) on the levels of LC3-I and -II in Shh and TR cells. The quantitative results normalized to β-actin are shown in the bar graph (right, *P < 0.01 vs. control and #P < 0.05 vs. E64d + pepstatin A treated, n = 3). F: representative Western blots (left) showing the effects of N-Shh and bafilomycin A1 treatment (24 h) on the levels of LC3-I and -II in TR cells. The quantitative results normalized to β-actin are shown in the bar graph (right, *P < 0.01 vs. control and #P < 0.05 vs. N-Shh treated, n = 3). G: real-time quantitative PCR showing the mRNA levels of autophagy-related gene 7 (ATG7) in TR cells transfected with negative-control (NC) small-interfering RNA (siRNA) or ATG7 siRNA for 48 h (*P < 0.05 vs. NC siRNA control, n = 3). H: representative Western blots (left) showing the effects of N-Shh treatment (24 h) on the levels of LC3-I and -II in TR cells transfected with NC siRNA or ATG7 siRNA for 48 h. The quantitative results normalized to β-actin are shown in the bar graph (right, *P < 0.01 vs. NC siRNA control, #P < 0.05 vs. N-Shh + NC siRNA control, n = 3).

