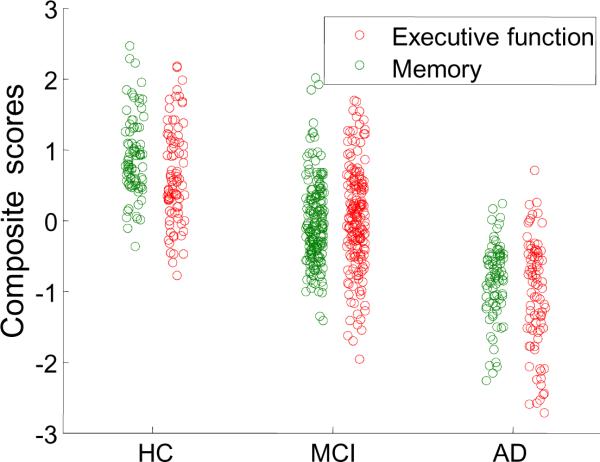
Figure 1. Memory and Executive Function Composite Scores by Diagnostic Group.
Scatter plots of memory and executive function composite scores across diagnostic groups. The ADNI-Exec score is plotted in red, the ADNI-Mem score is plotted in green. Both show strong associations with diagnosis (AD, MCI, HC).

