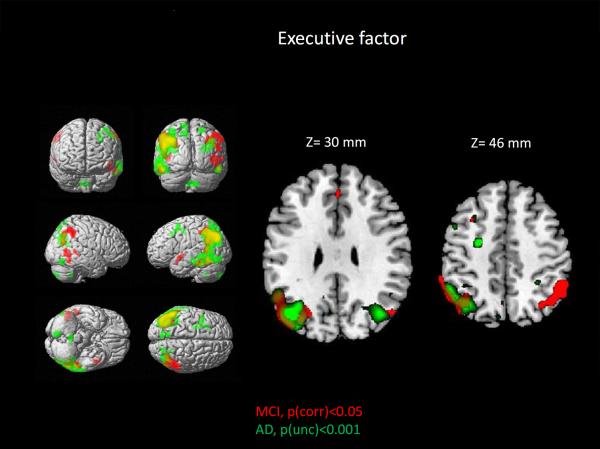
Figure 2. Relationship between brain metabolism and executive function in patients with MCI and AD.
Visualization of super-threshold local maxima in rendered surface images and selected axial slices for the topography of associations between FDG PET measures of brain metabolism and executive function (ADNI-Exec), displayed for both AD (green; p<0.001, uncorrected for multiple comparisons, minimum cluster size (cs)=50 voxels) and MCI (red; p<0.05, FWE correction for multiple comparisons, cs=50 voxels). Significant associations in both groups were primarily observed in bilateral parietal and temporal lobes. In addition, notable overlap of regions with significant associations are observed (yellow).

