
Fig. 2.
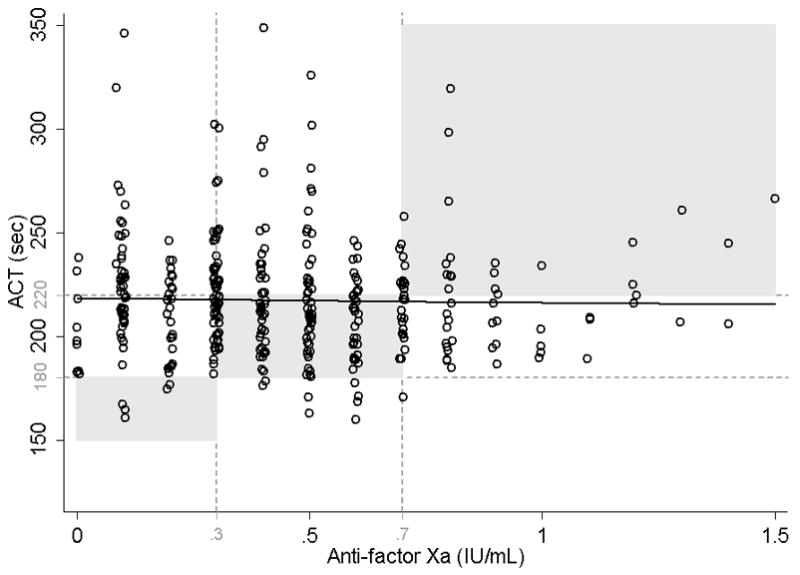
Correlation of simultaneously measured activated clotting time (ACT) and anti-factor Xa.
Agreement for clinically meaningful values was defined as: ACT <180 s corresponding to anti-factor Xa <0.3 IU/mL, ACT 180–220 s corresponding to anti-factor Xa 0.3–0.7 IU/mL and ACT >220 s corresponding to anti-factor Xa >0.7 IU/mL. Shaded areas represent agreement between ACT and anti-factor Xa, seen in only 42% of measurements. Longitudinal linear regression: y = 218.5+7.2x, p = 0.251, r = −0.02.