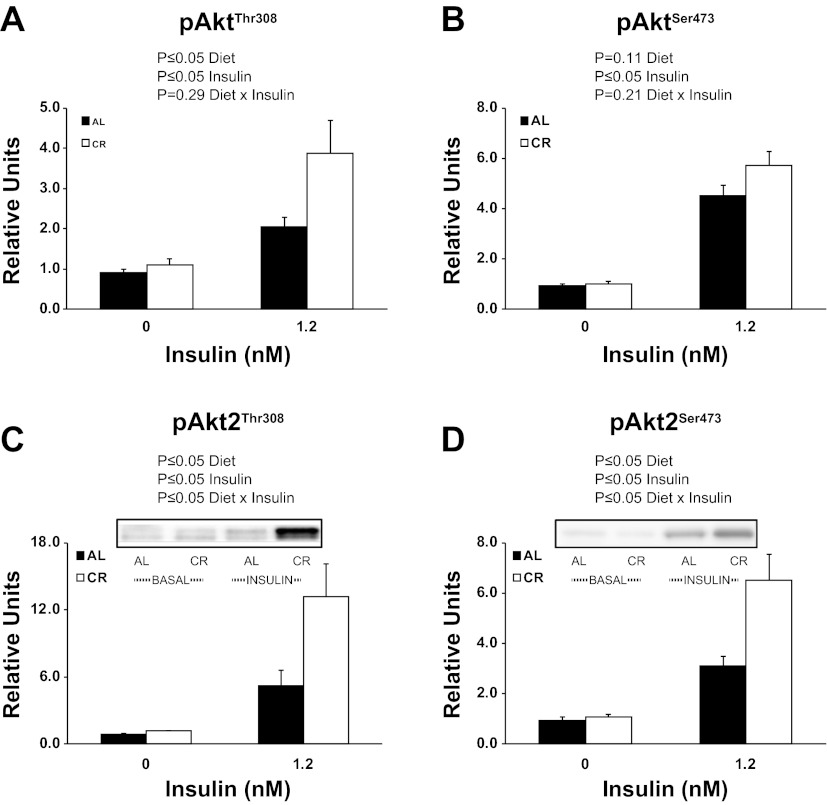
Fig. 2.
Phosphorylation of AktThr308 (A), AktSer473 (B), Akt2Thr308 (C), and Akt2Ser473 (D). Main effects of diet, insulin, and diet × insulin interactions are reported from two-way ANOVA analysis. P ≤ 0.05 is considered statistically significant. Values are means ± SE; n = 7–18 per treatment group.

