
Figure 8.
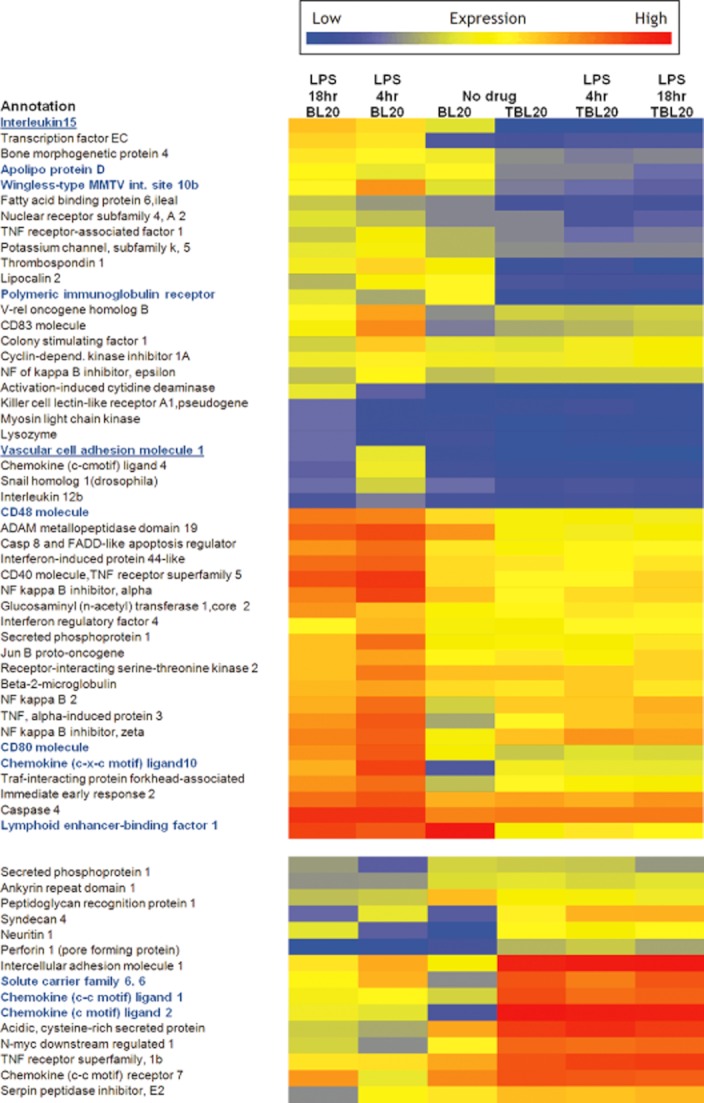
Hierarchical clustering of NF-κB response genes. The NF-κB targets genes identified in the infected cell-modulated gene list were selected for hierarchical clustering analysis and the results are presented as a heat map. Genes highlighted in bold show altered array expression following BW720c treatment for 48 h to kill the parasite. Underlined genes show altered RT-PCR expression following BW720c treatment for 72 h.