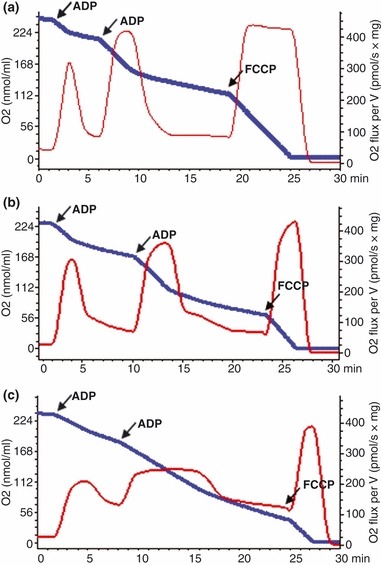
Figure 2.

High resolution respirometry of PND9 mouse brain mitochondria isolated using methods A (a), B (b) and C (c). Experiments were performed as described in ‘Materials and methods: mitochondrial respiration’ section. The blue trace displays the oxygen concentration (nmol/mL, Y1) and the red traces show the real-time oxygen consumption rate (pmol O2/s × mg mitochondria, Y2) of mitochondria oxidizing 4.8 mM pyruvate and 2.5 mM malate. ADP (50 mM) was added twice to induce a transient active phosphorylating rate of respiration. Traces are representative examples of three separate experiments.
