Figure 3.

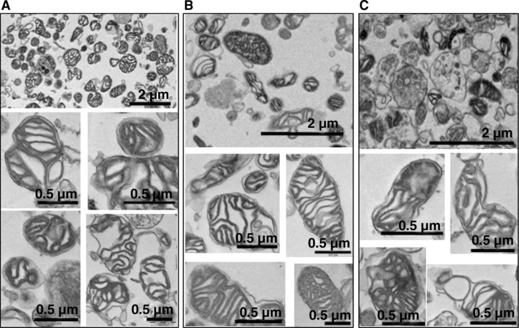
Electron photomicrographs of mitochondria from methods A, B and C. Bar = 2 μm in low magnification pictures, Bar = 0.5 μm in all high magnification pictures.

Electron photomicrographs of mitochondria from methods A, B and C. Bar = 2 μm in low magnification pictures, Bar = 0.5 μm in all high magnification pictures.