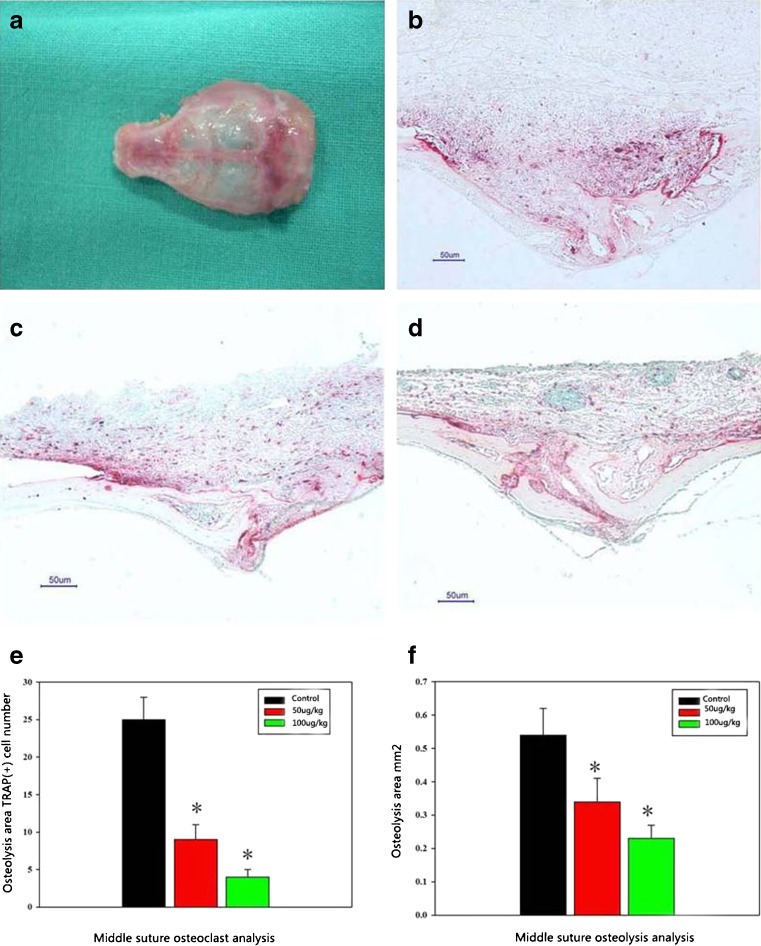
Fig. 3.
a In vivo mouse calvarial osteolysis sample. b, c, d PMMA induced bone resorption and the osteoclastogenesis (TRAP stain) in the control group, the 50 μg/kg group and the 100 μg/kg group. e, f The osteolysis area calculation and the TRAP staining positive cell count in three groups (control, 50 μg/kg, 100 μg/kg). *Significant difference compared with the control group (P < 0.05, n = 6)

