Fig 3.

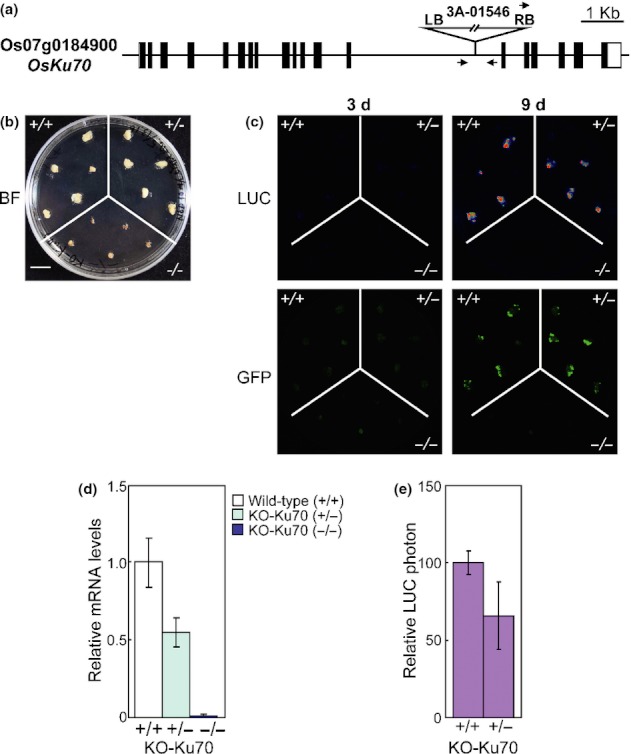
Efficiency of stable transformation in wild-type and KO-OsKu70 mutant rice (Oryza sativa) calli. (a) Schematic diagram of the OsKu70 (Os07g0184900) gene showing the position of the inserted T-DNA (3A-01546). Open and solid bars show the untranslated regions and coding region, respectively. The primer sets used in genotyping are represented by arrows. (b,c) Bright-field image (BF, left panel), luciferase luminescence image (LUC, upper right panel) and green fluorescent protein fluorescence image (GFP, lower right panel) of wild-type (+/+), KO-OsKu70 heterozygous mutant (+/−) and KO-OsKu70 homozygous mutant (−/−) rice calli. Bar, 1 cm. The Green fluorescent protein (GFP) signal observed on rice calli at an early transformation stage (3 d after Agrobacterium infection) was derived from the transient expression of T-DNA which was not integrated into the rice genome. Luciferase luminescence (LUC), as represented by the false color scale, on rice calli at the late transformation stage (9 d after Agrobacterium infection) was derived from the stable expression of T-DNA which was integrated successfully into the rice genome. Bar, 1 cm. (d) Quantitative reverse transcriptase-polymerase chain reaction (RT-PCR) analysis of OsKu70 transcripts in wild-type (+/+), KO-OsKu70 heterozygous mutant (+/−) and KO-OsKu70 homozygous mutant (−/−)rice calli. Error bars represent ± SD of three individual experiments. (e) Graphical representation of LUC luminescence intensity on wild-type (+/+), KO-OsKu70 heterozygous mutant (+/−) and KO-OsKu70 homozygous mutant (−/−) rice calli at 9 d after infection. Relative LUC luminescence levels were normalized to LUC luminescence levels of control calli (= 100). Agrobacterium-mediated stable transformation assays were performed using three independent batches. Error bars represent ± SD.
