
Figure 1.
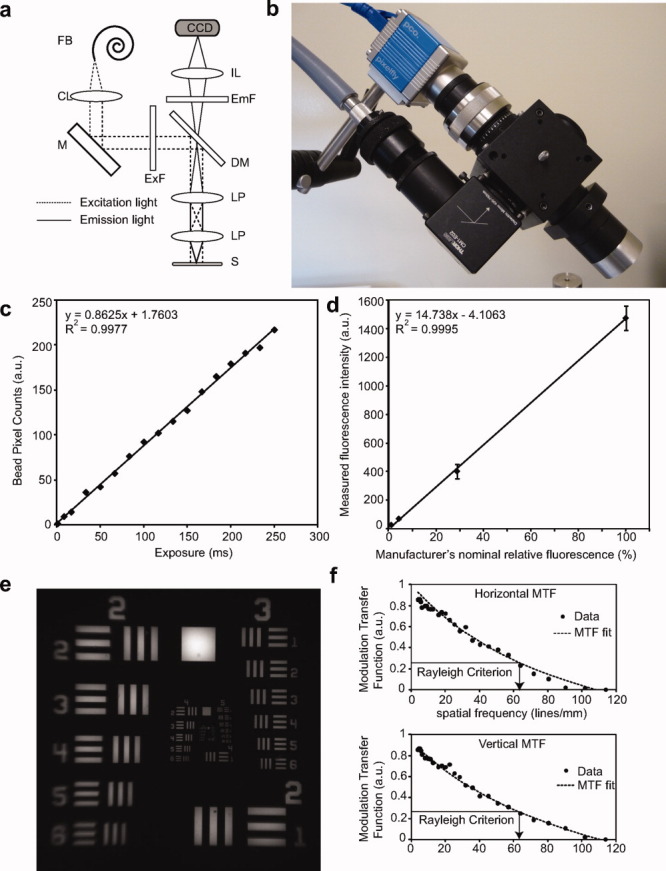
These images illustrate and characterize the prototype device. (a) Optical diagram of the intraoperative imaging device. A fiber bundle (FB) is connected to a light source and attaches to the device. A collimating lens (CL) collects the input light, and a mirror (M) reflects the light toward a band-pass excitation filter (ExF). A long-pass, dichroic mirror (DM) reflects the excitation light toward a lens-pair (LP) to illuminate the specimen (S). Fluorescence emission from the sample is transmitted through the DM and is spectrally filtered by a band-pass emission filter (EmF). An imaging lens (IL) focuses the fluorescence emission into a charge-coupled device (CCD). (b) Photograph of prototype imaging device. (c) Pixel intensities acquired from fluorescent microspheres imaged at different exposure times demonstrate a linear response of the device to exposure time (line fit). (d) Analysis indicated that the device had a linear response to 100-fold changes in intensity (line fit). Error bars indicate standard deviation from the mean. (e) Image of a standard US Air Force 1951 resolution target that was acquired with the imaging device to determine the spatial resolution of the system. (f) Horizontal and vertical contrast transfer functions are illustrated for the imaging system measured with the target image from e. The horizontal and vertical spatial frequency resolution limits are 62.8 and 63.0 cycles/mm, respectively. These correspond to approximately 16 μm of spatial resolution in both axes. MTF indicates modulation transfer function.