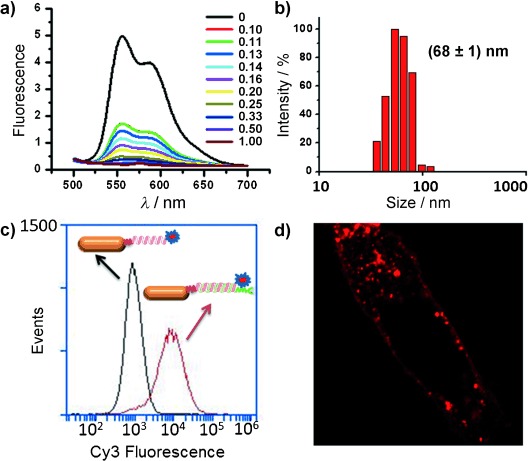
Figure 2.

a) Fluorescence spectra of the Dox (1 μM) solution with increasing molar ratio of hybridized DNA duplex (from top to bottom: 0, 0.10, 0.11, 0.13, 0.14, 0.16, 0.20, 0.25, 0.33, 0.50, and 1.00 equiv) at an excitation of 480 nm. b) Hydrodynamic size distribution of T-DNA-NR showing the mean value at 68 nm. c) Flow cytometry profile of cellular binding and uptake of nontargeted ONT-NR-Cy3 (black line) and targeted T-DNA-NR-Cy3 (red line) in KB cells. d) A representative confocal image showing the cellular distribution of T-DNA-NR-Cy3.
