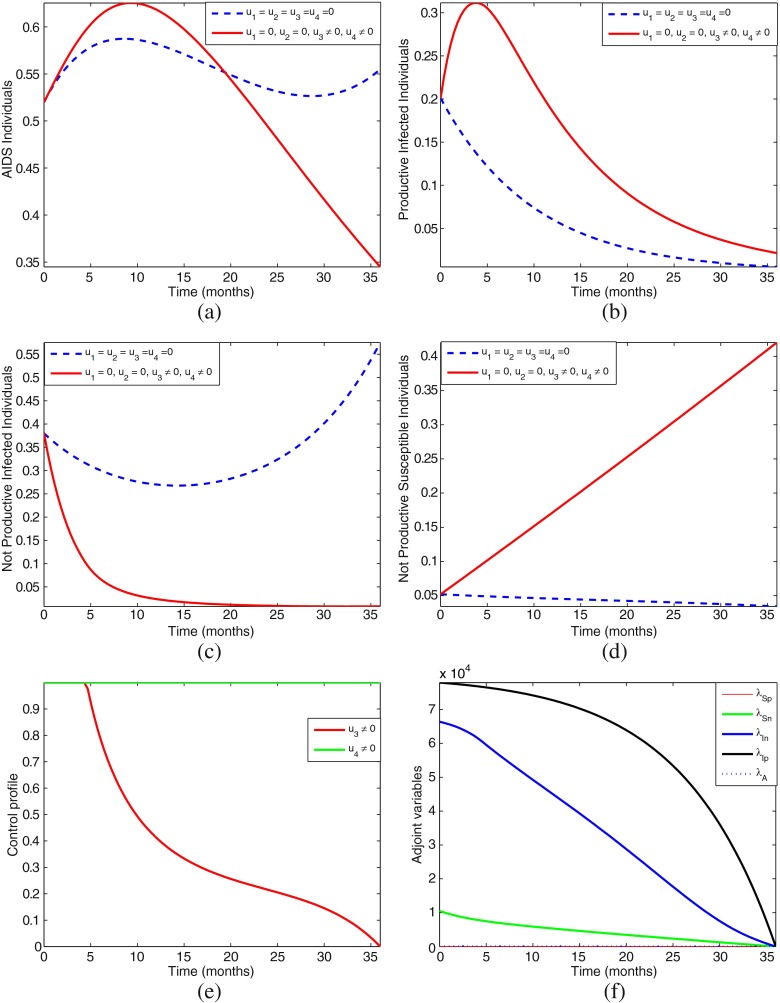
Fig. 5.
Simulations of the model showing the effect of control strategy F on HIV/AIDS transmission. The control profile suggests control u3 be at the upper bound for just 4 months before dropping gradually to the lower bound and control u4 to be maintained at the upper bound throughout the intervention period

