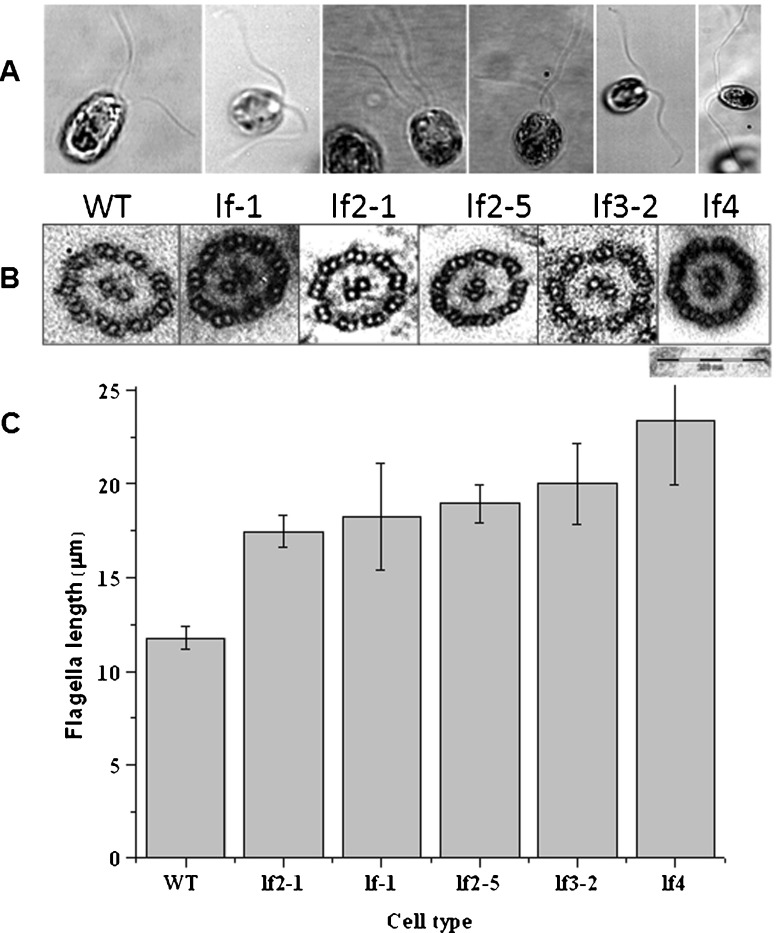
Fig. 1.
A Images of WT and long-flagella mutants depicting differences in flagellar length. B TEM of axonemes from WT and long-flagella mutants, magnification 50,000×, Bar = 200 nm. C Flagellar length (in μm) of WT and long-flagella mutant cells. Cells were stained with iodine (see text) to enhance contrast and facilitate measurement

