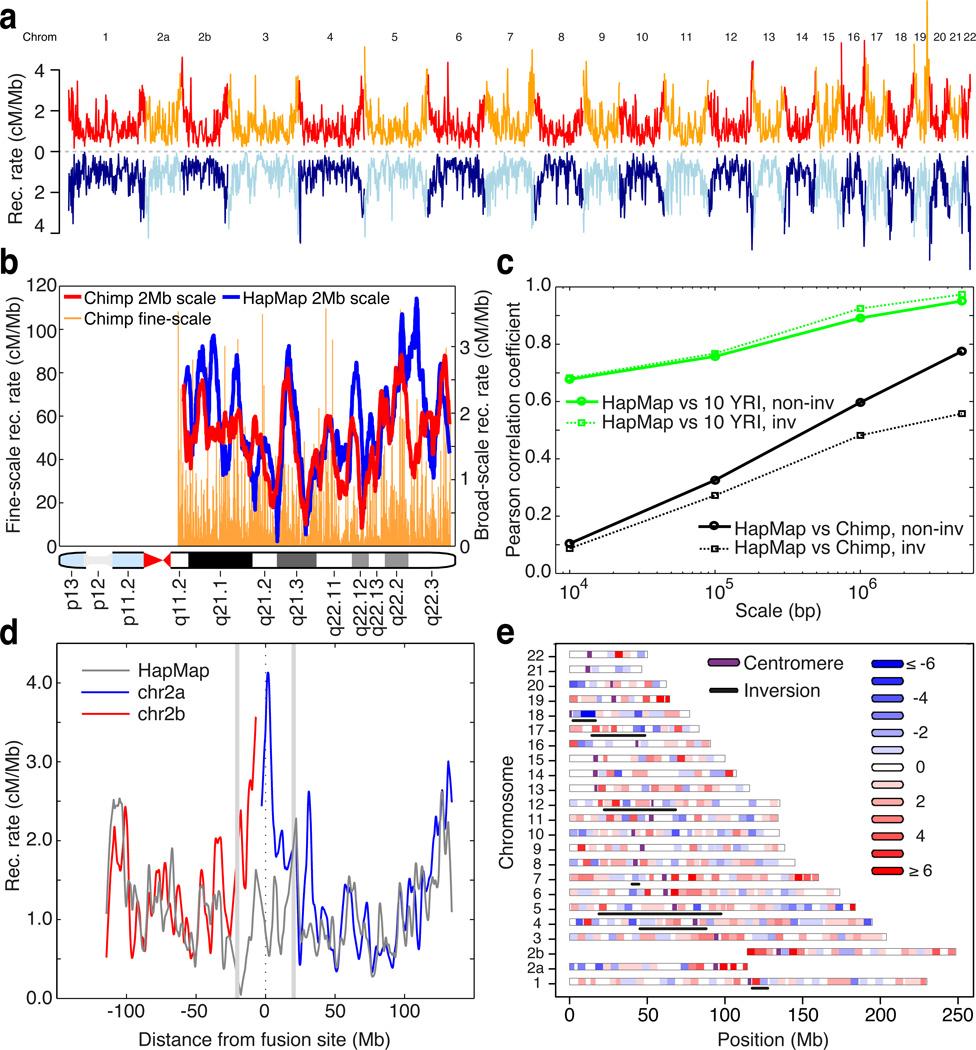
Figure 1.
Evolution of recombination rates between humans and chimpanzees. (a) Genome-wide comparison of recombination rates for chimpanzee (red / orange) and human (light / dark blue); averaged over 1 Mb windows in regions of synteny. Unless otherwise stated, human rates are from the population-averaged HapMap genetic map (16). (b) Recombination rates estimated in human (blue) and chimpanzee (red) along chromosome 21q, averaged over 2Mb intervals; fine-scale rates shown behind. (c) Pearson correlation coefficients at different scales, estimated between the recombination rates of chimpanzee and HapMap YRI (black), and between chimpanzee and ten 1000 Genomes YRI samples (green). Non-inverted regions: solid lines, inverted regions: dotted lines). (d) Recombination rates in 2Mb syntenic windows along chimpanzee chromosomes 2a and 2b (blue, red) and the corresponding syntenic region of human chromosome 2 (grey) derived from an ancient telomeric fusion. (e) Differences between chimpanzee and human recombination rates in 5Mb syntenic windows across the genome. Regions involved in inversions are underlined.

