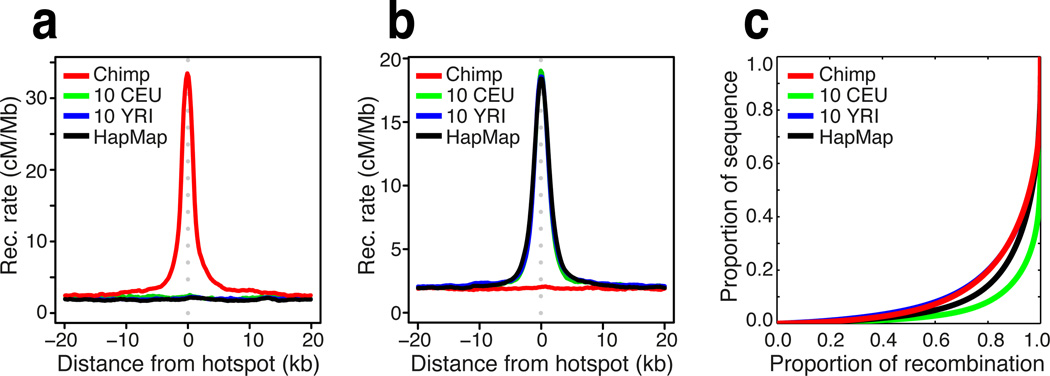
Figure 2.
(a) Recombination rates around hotspots identified in chimpanzee (red) at syntenic regions in CEU (green), YRI (blue), and HapMap (black). (b) As for (a) but around sites identified as recombination hotspots in 10 YRI; see also Figure S4. (c) The concentration of recombination rate in fine-scale genetic maps estimated from the chimpanzee and equivalent data from human populations of European (CEU) and African (YRI) ancestry (23). The higher degree of concentration see in African relative to European populations likely reflects the greater diversity of PRDM9 alleles in the population (11).

