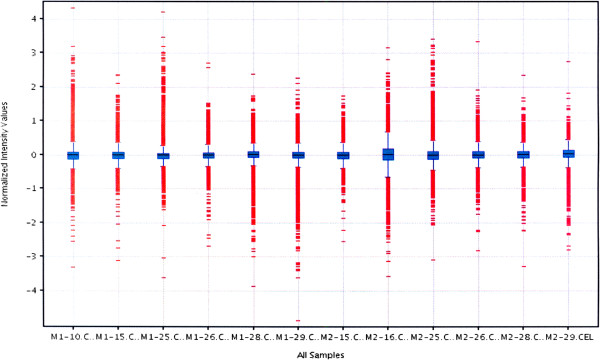
Figure 4.
Comparison of fluorescence intensity values of 12 paravertebral muscle HGU 133 A (Affymetrix) oligonucleotide microarray chips (M1, M2 – adequately muscular tissue from curve concavity and convexity). Every box-and-whisker plot represents 22283 mRNA probes fluorescence intensity values normalized with RMA algorithm. All signals based to median (black horizontal lines), height of the rectangle (blue) determines the value of interquartile range; outliers marked in red.

