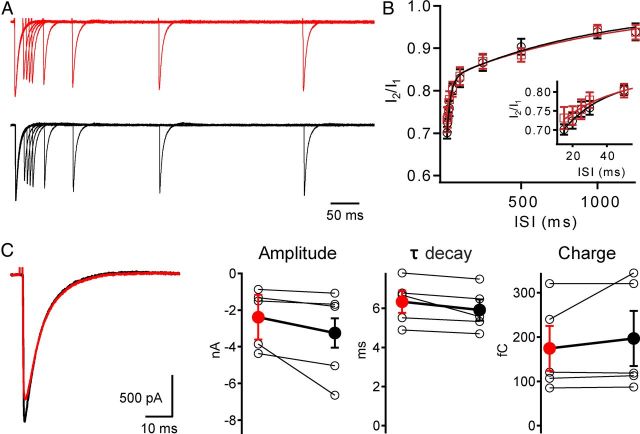
Figure 3.
Optical activation of ChR2-eYFP-expressing CFs faithfully reproduces physiological activation. A, CF synaptic currents resulting from pairs of optical (black) or electrical (red) stimuli with differing interstimulus intervals (ISI; 5–1250 ms) are displayed. Currents normalized to first pulse. B, Both electrical (red squares) and optical (black circles) stimulation result in similar, stereotypical paired-pulse depression of CF currents. Curves are two exponential fits to average data. Inset, Increased time resolution for shorter ISIs. C, Within the same PNs, CF EPSCs are not significantly different for the two stimulus paradigms (amplitude: Electrical −2.4 ± 0.8 nA, Optical −3.3 ± 1.2 nA, p = 0.1; τ-decay: Electrical 6.3 ± 0.6 ms, Optical 5.9 ± 0.5 ms, p = 0.6; charge: Electrical 175 ± 51 fC, Optical 197 ± 62 fC, p = 0.8; n = 5).

