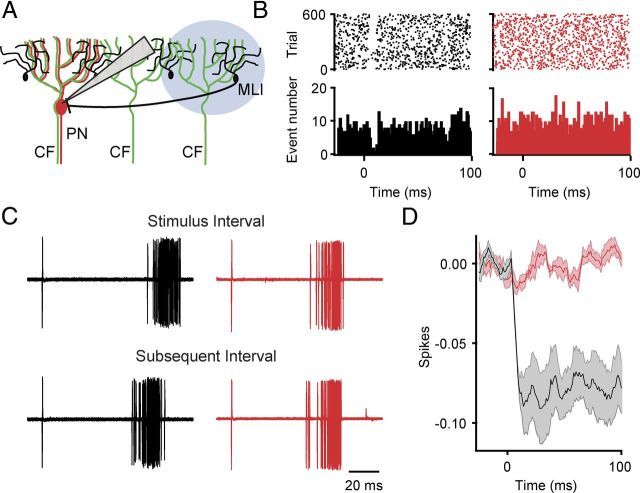
Figure 7.
CF excitation of MLIs transiently inhibits spontaneous PN activity. A, Illustration of the optical stimulation paradigm used to activate CFs adjacent to an extracellularly recorded PN, allowing for CF-driven activation of adjacent MLIs. B, On the left in black is a control raster plot (top) and PSTH (bottom) from an example PN in response to 600 optical stimuli (1 ms light pulse, at 2 Hz). On the right in red is a raster plot (top) and PSTH (bottom) from the same cell after bath application of picrotoxin. Bin, 2 ms. C, The extracellular spikes occurring just before optical stimulation are temporally aligned (top) to illustrate the duration of intervals as the result of feedforward inhibition (first 60 trials from experiment shown in B). Illustrated below is the duration of the subsequent interval obtained by aligning the peak amplitude of the spike occurring directly after the optical stimulation (i.e., the second spike shown above; 89.5 ± 0.6 ms vs 78.2 ± 0.4 ms for the subsequent interval, p < 0.0001 for this cell, n = 600 trials). Unlike in control (black) the duration of the subsequent interval after application of picrotoxin (red) is not significantly shorter (65.7 ± 0.1 ms vs 65.4 0.2 ms for subsequent interval, p = 0.22, n = 600 trials). D, Summary cumPSTH illustrating the number of spikes lost as the result of feedforward inhibition before and after picrotoxin application (n = 6 neurons). Bin size,1 ms.

