Abstract
With advances in MRI technology, Dynamic-Contrast-Enhanced (DCE) MRI is approaching the capability to simultaneously deliver both high spatial- and temporal-resolutions for clinical applications. However, Signal-to-Noise Ratio (SNR) and Contrast-to-Noise Ratio (CNR) considerations, and their impacts regarding pharmacokinetic modeling of the time-course data continue to represent challenges in the design of DCE-MRI acquisitions. Given that many acquisition parameters can affect the nature of DCE-MRI data, minimizing tissue-specific data acquisition discrepancy (among sites and scanner models) is as important as synchronizing pharmacokinetic modeling approaches.
For cancer related DCE-MRI studies where rapid contrast reagent (CR) extravasation is expected, current DCE-MRI protocols often adopt a 3D fast low-angle shot (FLASH) sequence to achieve spatial-temporal resolution requirements. Based on breast and prostate DCE-MRI data acquired with different FLASH sequence parameters, this paper elucidates a number of SNR and CNR considerations for acquisition optimization and pharmacokinetic modeling implications therein. Simulations based on ROI data further indicate that the effects of intercompartmental water exchange often play an important role in DCE time-course data modeling, especially for protocols optimized for post-CR SNR.
Introduction
Dynamic-contrast-enhanced (DCE) magnetic resonance imaging (MRI) has become relevant to many clinical applications. However, for most DCE-MRI studies, such as that for breast, effective compromise between tissue coverage, spatial-temporal resolution, signal to noise ratio (SNR), and contrast to noise ratio (CNR) remains a major challenge. Significant potential exists for improving imaging speed with parallel imaging (1–3) and k-space undersampling (4, 5) approaches, and these are active areas of ongoing research effort.
Practically, most DCE-MRI protocols can easily generate around half a gigabyte data in minutes. The sheer quantity of information from a DCE study calls for systematic data summarization. To facilitate data analysis and cross-platform/vendor comparison, pharmacokinetic modeling of DCE-MRI data is highly desired. By analyzing DCE-MRI time-course data, pharmacokinetic modeling extracts parameters that only reflect biological characteristics of the tissue. However, MRI contrast is highly dependent on pulse sequence parameters which can be readily modified. Many of these parameters can be obscured due to an ever increasing demand for data acquisition convenience. Sometimes even a slight change in a sequence parameter may result in noticeable difference in final image contrast or quality. Thus acquisition parameter discrepancy may partially explain some irreproducibility in DCE-MRI studies. This is more noticeable between scanners of different vendors, but can easily occur even among instruments from the same manufacturer.
Since the general approach to obtain pharmacokinetic parameters involves both data acquisition and post-processing, it is important to optimize the DCE-MRI protocol with both aspects taken into consideration. SNR and CNR are important factors to consider for image acquisition, while data sensitivity to water exchange effects (that resulted from water molecules moving across tissue compartmental boundaries) is important in determining the appropriate pharmacokinetic model to fit time-course data. The goal of this study is to explore the consequences of different acquisition parameters on T1-weighted time-series and the associated DCE modeling. Our results show that when FLASH sequence is optimized for SNR under a given acquisition time and tissue coverage, DCE-MRI signal becomes sensitive to water-exchange effects and thus proper modeling the DCE-MRI signal time-course requires incorporation of water-exchange effects.
Methods
MRI Data Acquisition
Human studies were conducted under IRB approved protocols. Informed consent was obtained prior to each study. All MRI data were acquired on a Siemens (Erlangen, Germany) 3T TIM TRIO system before standard care biopsy procedures. For DCE-MRI, a contrast reagent (CR) bolus of 0.1 mmol/kg Prohance (Bracco Inc., NJ) was administered in an antecubital vein followed by 20 mL saline flush. The built-in body coil was used for RF transmitting.
Breast MRI
A four-channel receive-only coil was used for data acquisition. Besides T1- and T2-weighted anatomic images, DCE-MRI series acquired 22 axial bilateral imaging volumes with a temporal resolution of 26 s. The CR injection was initiated ~ 52 s after the start of DCE-MRI acquisition, i.e., after the acquisition of two baseline image volumes. Other parameters for the 3D FLASH sequence are: TR/TE : 4.4/1.48 ms, 3 mm slice thickness and 60 total slices, 1.2 × 1.0 mm in-plane resolution and parallel imaging acceleration factor, iPAT = 2. The total DCE-MRI acquisition was ~ 10 min. Three different flip angles (10°, 20°, 34°) were used for the DCEs for different T1–weighting and water-exchange sensitivity. A proton density (PD) weighted image of the same geometry was acquired pre-CR. Combining it with the mean DCE baseline image, intrinsic R1 (= 1/T1) values were numerically estimated. For two subjects, the T1-weighted 3D FLASH sequences also acquired pre- and post-CR data with different receiver bandwidths. Parameters for the additional sequences that differed from the DCE-MRI sequence were: TR/FA: 7.6 ms /18.5°, in-plane resolution 1 × 0.8, and minimum TEs (ms) of 2.07, 1.39, 1.19, 1.09, 1.04 determined by the corresponding bandwidths (Hz/pixel) of 130, 290, 450, 620, 770, respectively.
Prostate MRI
RF reception employed a combination of flexible body and spine matrix coils. To estimate pre-CR R1 values for each voxel, a proton density (PD) weighted image series of the prostate gland was obtained using a 3D FLASH pulse sequence with a 256*144*16 matrix size and a 360*203 mm2 transverse field-of-view (FOV), resulting in a nominal in-plane resolution of (1.4)2 mm2. Other parameters were: slice thickness, 3.2 mm; TR/TE/FA, 200 ms/1.56 ms/8°. For DCE-MRI, the same FLASH sequence was run with the only differences being TR = 5.0 ms and FA = 15°, which yielded a 6.28 s imaging temporal resolution. Intrinsic R1 value for each pixel was numerically determined using the PD image and the mean DCE baseline image. The CR injection was initiated ~ 38 s after the start of DCE-MRI acquisition, i.e., after the acquisition of six baseline image volumes. The DCE-MRI imaging time was ~ 10.5 min.
MRI Data Analysis
All data processing was performed using custom-written code in Matlab (Mathworks, Natick, MA, USA). Pharmacokinetic data fitting used nonlinear least square methods written in the same language.
SNR and CNR definition
Two SNR definitions were used based on recommendations in (6).
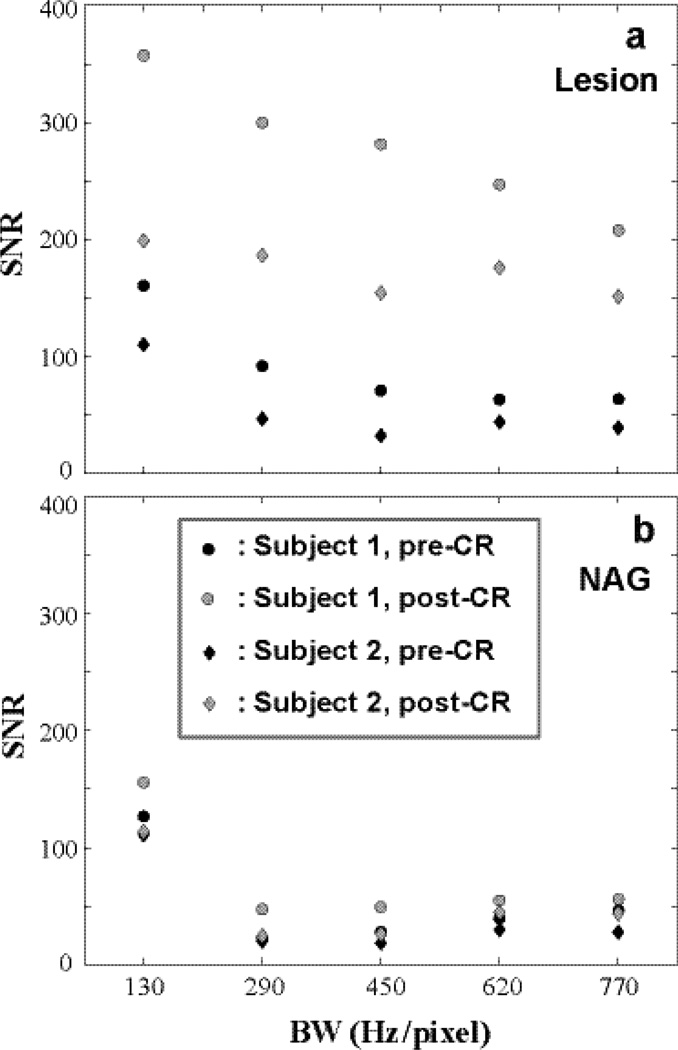
SNRstdv = [signal mean]/[noise standard deviation]; for single image, Figures 2–3.
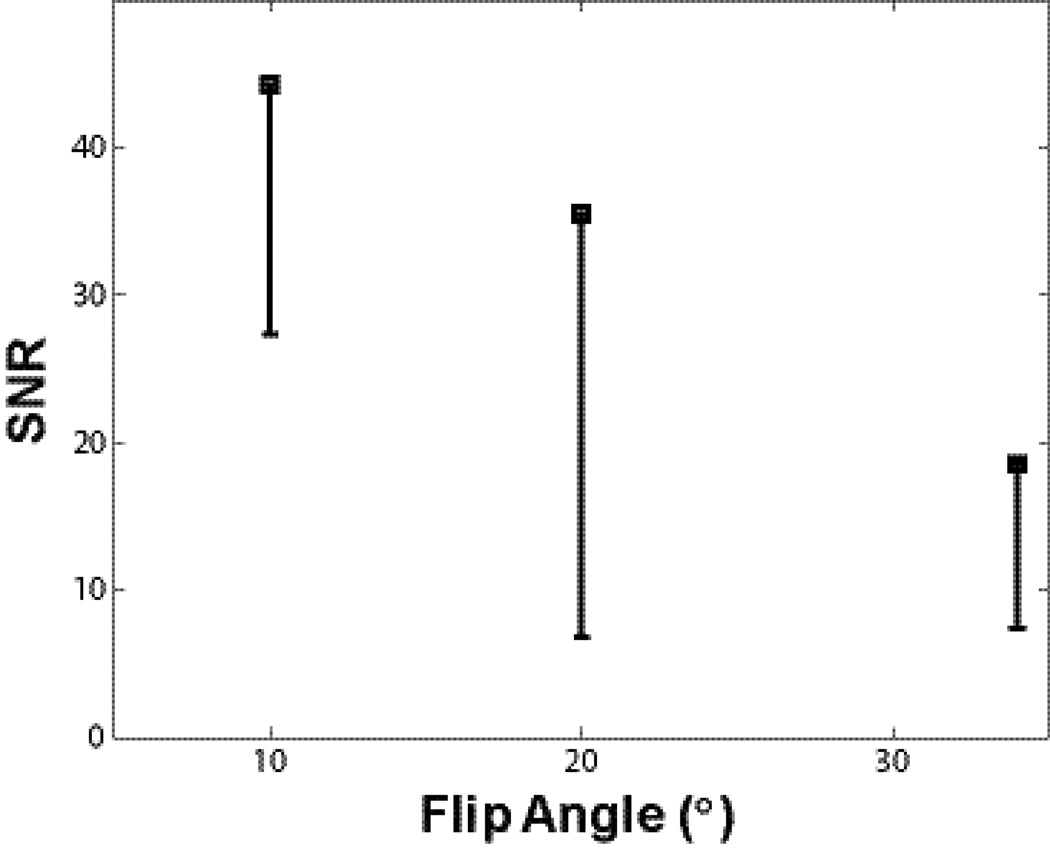
SNRmulti = [signal mean]/[standard deviation across baseline image frames]; for repeated measurements (e.g., DCE-MRI), Figures 4, 7–8.
Figure 2.
Pre- and post-CR SNRstdv of lesion and NAG ROIs of two subjects are shown. a for the two lesion ROIs and b for the two NAG ROIs. SNRstdv generally decreases with increasing BW (shorter TE) largely due to drastically increased noise. However, longer TE inevitably affects imaging weighting from heavily T1-weighted towards mixed weighting (T1- and T2*-weighted).
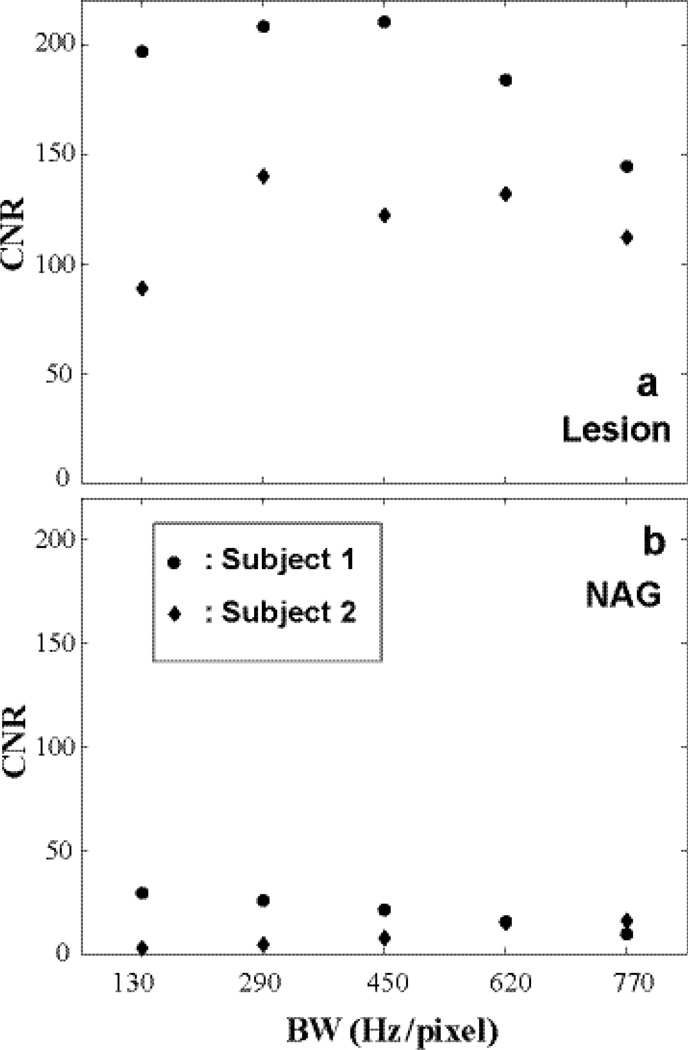
Figure 3.
The dynamic CNRs calculated from the Fig. 2 data are shown: a for lesion ROI comparing post- and pre-CR SNRs and b for that of NAG. When BW is too high, both SNR and CNR decrease due to increased noise. A mid-range pixel bandwidth of ~ 300 – 500 Hz/pixel produces better CNR for CR-enhancing lesion.
Figure 4.
SNRmulti from baseline DCE-MRI data are plotted against FA. Black squares indicate average pre-CR SNR at three different FAs from three equal-sized ROIs matching the smallest lesion. One standard deviation of pixel SNRmulti values within each ROI is plotted as the black error bars. Error bar length for the second subject (FA= 20°) is noticeable larger - due to its smallest lesion size and thus most prone to partial volume effect. A noticeable SNR decrease with increasing FA is seen.
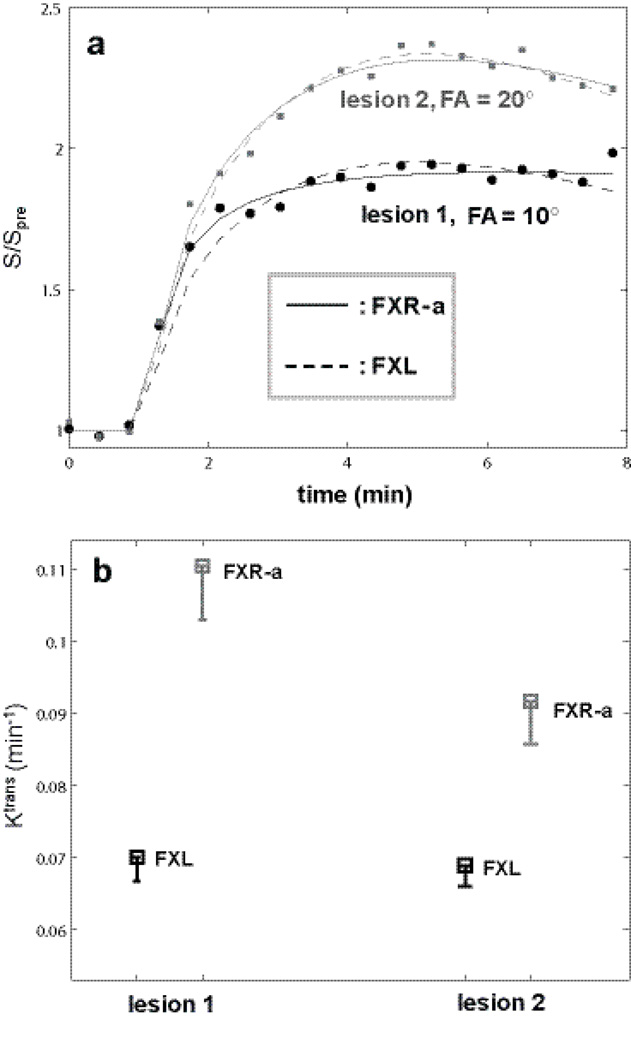
Figure 7.
Lesion ROI DCE time-course data were constructed for the two breast lesions with FAs of 10° and 20°, respectively, so that the FXL fitted results for both time courses returned similar parameter values. Four hundred simulation rounds were then carried out for each ROI time-course with random Gaussian noise directly added to the ROI data points. Panel a plots representative simulated ROI data and fitting results. Filled symbols (circles: lesion 1, 10° FA, squares: lesion 2, 20° FA) represent the time-course data points. The solid curves are fittings from FXR-a modeling and the dashed curves from FXL modeling. The apparent different relative enhancement (max. relative signal change for 10° is 95% and that for 20° is 135%) is largely due to the different flip angles used in data acquisition. The fact that the dashed and solid curves not overlap each other in both cases indicates that there are detectable water exchange effects in these data. Panel b summarizes Ktrans results with squares showing the mean Ktrans values and the bar length representing the standard deviation.
Figure 8.
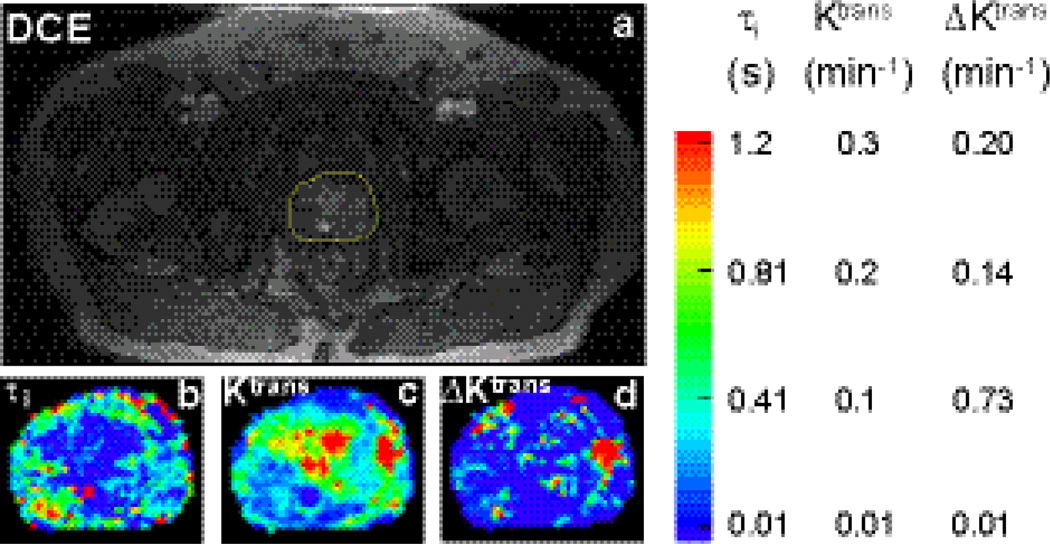
A post-CR DCE image of the prostate from one subject who had malignant foci found in the left peripheral zone (image right) is shown in a. Yellow outline indicates the ROI that covers the prostate and used for pharmacokinetic parametric mapping. Zoomed τi and Ktrans(FXL) color maps for the ROI in a are shown in panels b and c, respectively. Though Ktrans(FXL) values from the central zone are generally high, τi values are often much lower. This implies that it requires a much higher [CR] to drive the exchange system out of FXL in the central zone. The corresponding ΔKtrans map depicting the Ktrans difference between FXR-a (color map not shown) and FXL is shown in panel d. Most hot spots in the central zone area in b are now approaching zero, reflecting little detectable water exchange effects in this area. The suspicious lesion area shows elevated ΔKtrans values. ΔKtrans map provides a complementary contrast to that seen in the common Ktrans map (Fig. 8c).
When SNR is used without any subscript, it carries the generic meaning and if applicable, its definition is implied in the context. CNR was defined as:
CNRa,b = SNRa –SNRb; where subscripts a and b represent two imaging areas that are generally different in space location, time point, or both.
Compartmental Signal and Pharmacokinetic Modeling
The single compartment steady-state signal equation used for dynamic signal simulation is defined by:
| (1) |
where M is the measured signal intensity, M0 is proportional to fully relaxed magnetization, TR is the repetition time, and α is the flip angle (FA) of the read-pulse, assumed constant. T2* effect due to non-zero TE is ignored in Eq. (1). R1 is the longitudinal relaxation rate constant that is sensitive to voxel CR concentration, [CR]. Equation (2) defines the commonly adopted linear relationship:
| (2) |
where r1 is the CR relaxivity and R10 is the intrinsic 1H2O R1 without CR.
To illustrate the water exchange effect, a simple two compartment (one accessible and the other inaccessible to CR) model was employed. No-eXchange-Limit (NXL) and Fast-Exchange-Limit (FXL) conditions were simulated based on Eq. (1) that expanded for two compartments. For NXL, individual compartmental steady-state signals were calculated using Eq. (1) and summed. For FXL, the weighted-average R1 (= pA•R1A + pB•R1B, where A and B denote compartments with pA and pB for 1H2O population fractions and R1A and R1B for the relaxation rate constants of the sites, respectively) was calculated first, then Eq. (1) is used to calculated the steady-state MRI signal based on the sum of the two populations. An example with associated parameter numerical values are given in the Results section covering Figure 6.
Figure 6.
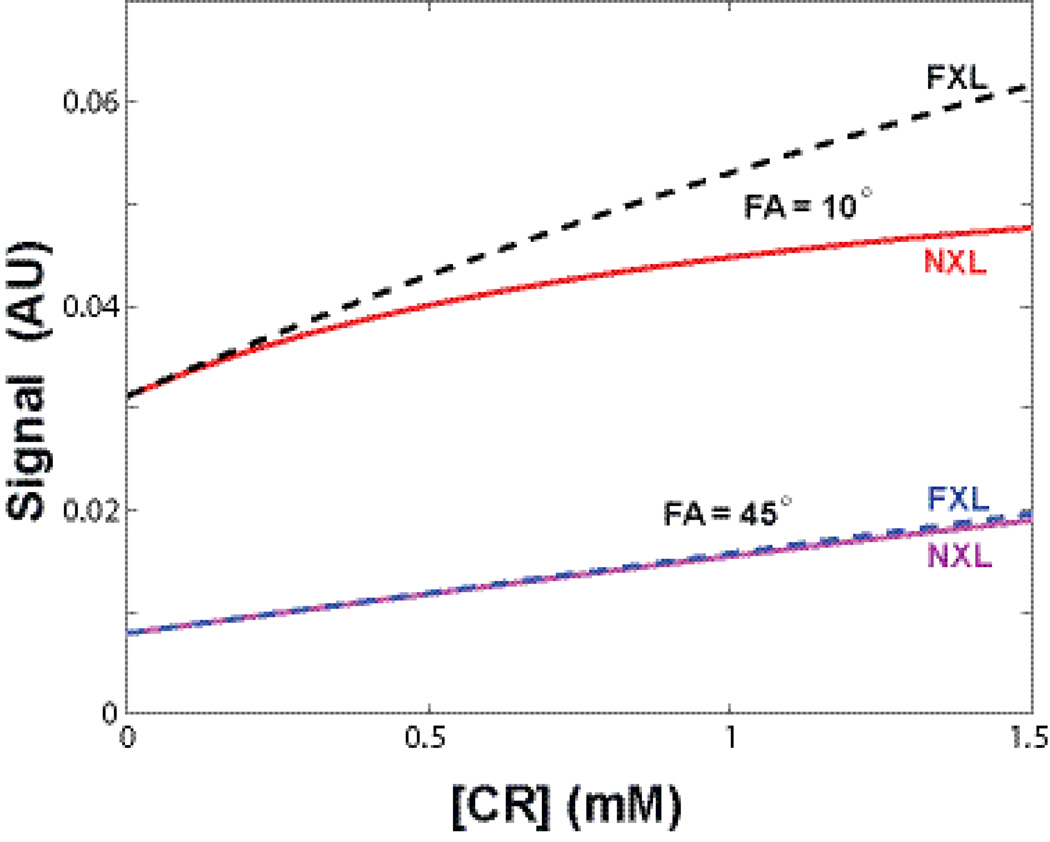
Simulated two-site model DCE-MRI signal vs. [CR] curves for NXL and FXL conditions at two FAs (10° and 45°) were plotted. The NXL and FXL curves are nearly identical for FA = 45°, representing the well-known 1H2O exchange-minimized approach. By reducing FA to 10°, the signal is more than doubled during the entire [CR] range. Even at relatively low [CR], the FXL and NXL curves clearly depart from each other, i.e., the water exchange effects are automatically encoded into DCE-MRI signal. The signal difference between the FXL (dashed black) and NXL (red) quantifies water exchange sensitivity for a particular pulse sequence. T2* effect is not considered in this simulation.
Pharmacokinetic modeling of the DCE-MRI time-course data employed both the FXL standard Tofts’ model (7) and the Fast-eXchange-Regime allowed (FXR-a) model (8–11). For standard FXL model, Ktrans (CR transfer rate constant) and ve (extravascular, extracellular volume fraction) were fitted. For the exchange sensitized FXR-a model, an additional τi (mean intracellular water lifetime) parameter was also included in the fittings.
Results
SNR and CNR Considerations
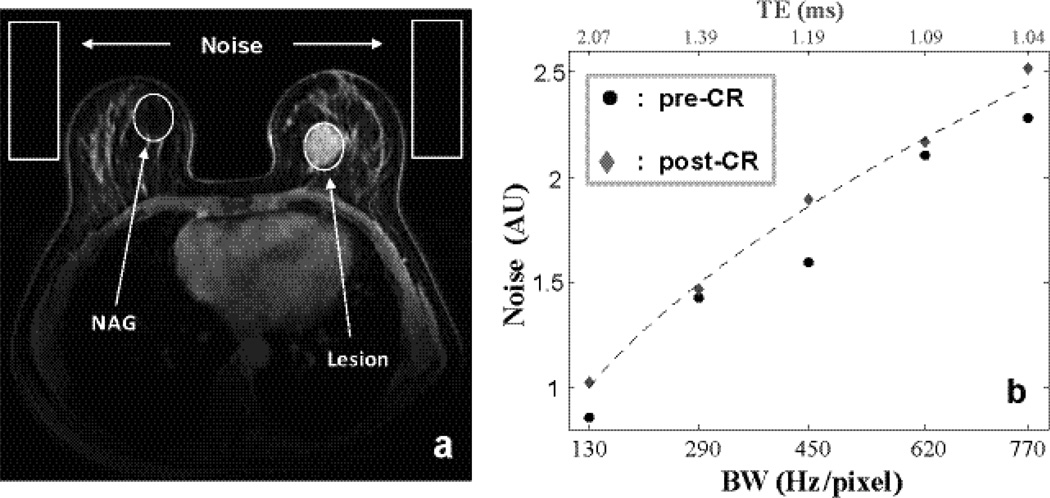
One common rule of thumb in DCE-MRI is to use the minimum TE allowed by the sequence. However, as one can expect, a minimum TE is always tied to a given receiver bandwidth (BW). In typical imaging protocols where the BW is governed by readout gradient amplitude and image size, signal integration time is not constant, thus the apparent noise increases with increasing BW (20). Figure 1a, shows a post-CR T1w image at BW of 290 Hz/pixel, corresponding to a minimum TE of 1.39 ms on the TIM Trio. Four regions of interest (ROIs) defining the contrast-enhanced breast lesion, normal appearing gland (NAG) and two noise locations are indicated. The contrast-enhanced MRI lesions were confirmed by a breast radiologist to match those found in mammography or ultrasound images and were later biopsied under ultrasound guidance. The NAG ROIs were selected where there were no contrast enhancements and no correlates of suspicious mammography or ultrasound findings. With all other parameters held fixed, pre- and post-CR T1w MRIs were repeated at five different BWs. Fig. 1b plots the measured mean noise intensities against BW. The BW and TE arrays are displayed at panel 1b bottom and top, respectively. As BW increases, minimum TE decreases from left to right. But TE reduction comes at the expense of additional noise and reduced signal integration time. The generally lower pre-CR noise signals (circles) may indicate that 100% decoupling between each pair of coils is not achieved (12, 13). The dashed curve shows the predicted noise change with BW (12).
Figure 1.
A post-CR T1–weighted image of a 56 year old woman at bandwidth (BW) of 290 Hz/pixel (corresponding to a minimum TE of 1.39 ms) is shown in a. Four regions of interest (ROIs) defining lesion, normal appearing gland (NAG) and two noise locations are indicated. b plots the measured pre- and post-CR mean noise intensities against BW. As BW (abscissa bottom) increases, minimum TE (abscissa top) decreases from left to right. Noise increases with larger receiver BW. Noise as a function of BW is plotted in dashed line.
Figure 2 plots pre- and post-CR signal to noise ratios, SNRstdv (6), of the lesion and NAG ROIs for two breast subjects. Panel a shows pre- and post-CR SNRstdv values for two lesion ROIs. For each given data set (e.g., filled black circle), SNR generally decreases with increasing BW (despite shorter TE) largely due to drastically increased noise and reduced signal integration time. The signal decay due to T2* effect was not a major factor for SNR measurement for this small range of TE difference (max. ΔTE = 1.03 ms). However, it is misleading to attempt to optimize SNR by increasing TE further, as longer TE inevitably affects imaging weighting from predominately T1-weighted towards mixed T2*- and T1-weighted and provides reduced immunity to chemical shift artifacts. A negative consequence for increased TE may include reduced lesion conspicuity. Further increasing TE is detrimental as T2* effects will severely affect signal properties and image contrast. Since the data were acquired with iPAT = 2, the noise distribution could be affected due to multiple channel imaging reconstruction and we did not image this distribution. However, given the only difference is the minimum TE values, the relative SNR comparisons should still reflect the general trend.
Imaging conspicuity is closely related to contrast to noise ratio (CNR). For DCE-MRI, dynamic CNR that compares signal change at different time points may be of particular interest and can be defined as the SNR difference at the time points of interest. Figure 3 shows the dynamic CNRs (post-CR SNR minus pre-CR SNR) of Figure 2 data, a for lesion and b for NAG.
It is clear that when BW is too high, both SNR and CNR suffer due to increased noise. On the other hand, when BW is low (or minimum TE is long), the CNR is not optimal due to the increased T2* relaxation effect. Thus, a mid-range BW of ~ 300 – 500 Hz/pixel is generally desired for DCE-MRI acquisitions. This does not include applications designed to minimize susceptibility and chemical shift artifacts where large BW (short TE) is required.
On current generation MRI instruments, the TE parameter often can be adjusted freely from minimum allowed value to an upper range limit. This may not represent the best practice in DCE-MRI protocol optimization as added delay increases T2* weighing in the nominally T1-weighted sequence with little benefit for SNR or CNR. Thus, adjusting TE should be tied to receiver BW. However, adjusting TE without changing the BW could be beneficial for investigating effects associated with T2* in DCE-MRI.
It is intuitive to select stronger T1-weighting for better T1 sensitivity and potentially larger R1 dynamic range. For FLASH acquisitions, this implies shorter TR and/or larger FA combinations. Figure 4 demonstrates DCE-MRI baseline SNRmulti dependence on FA at fixed TR (4.4 ms). For time-series measurements inherent to DCE-MRI, SNRmulti, defined as tissue signal divided by the standard deviation (SD) of the multiple-point baseline signal, has been demonstrated to be a more robust measurement (6). Black squares plot average pre-CR SNRmulti at three different FAs from three equal-sized ROIs placed in the three lesions. Standard deviation of SNRmulti for all pixels within the ROIs are plotted as black bars. Bar length for the middle subject (FA= 20°) is noticeable larger due to its smallest tumor size and thus most likely prone to partial volume effect. A noticeable SNR decrease with increasing FA is clearly visible. This is mostly due to T1 saturation effects with maximum SNR expected near the Ernst angle. Similar SNR trend around Ernst angle for different tissue type (body part) is observed besides this inter-subject measurement. In addition, intra-subject measurements in prostate DCE-MRI with a similar FLASH sequence using body/spine matrix coils reveal very similar trends with TR = 5 ms and FA incremented from 5° to 30° by step size of 5°. Here, expected Ernst angle for a prostate R1 ~ 0.63 s−1 is less than 5°, thus a monotonic decrease of SNR vs. increasing FA was observed (data not shown). Obviously, post-CR injection SNR will be dependent on CR extravasation rate. For FLASH sequence, the general trend of noticeable SNR penalty with short TR and large FA combinations are commonly observed. To maintain heavy T1-weighting and account for the increase of Ernst angle post-CR, DCE-MRI studies are almost always performed with FAs far greater than pre-CR Ernst angle (for breast protocol with TR = 4.4 ms, Ernst angle is again less than 5°). Thus, baseline SNR decreases monotonically with increasing FA and the post-CR SNR generally follows the same trend. However, it is primarily the dynamic CNR (proportional to the signal difference of post-CR and baseline) of a DCE-MRI time-series that draws most attention.
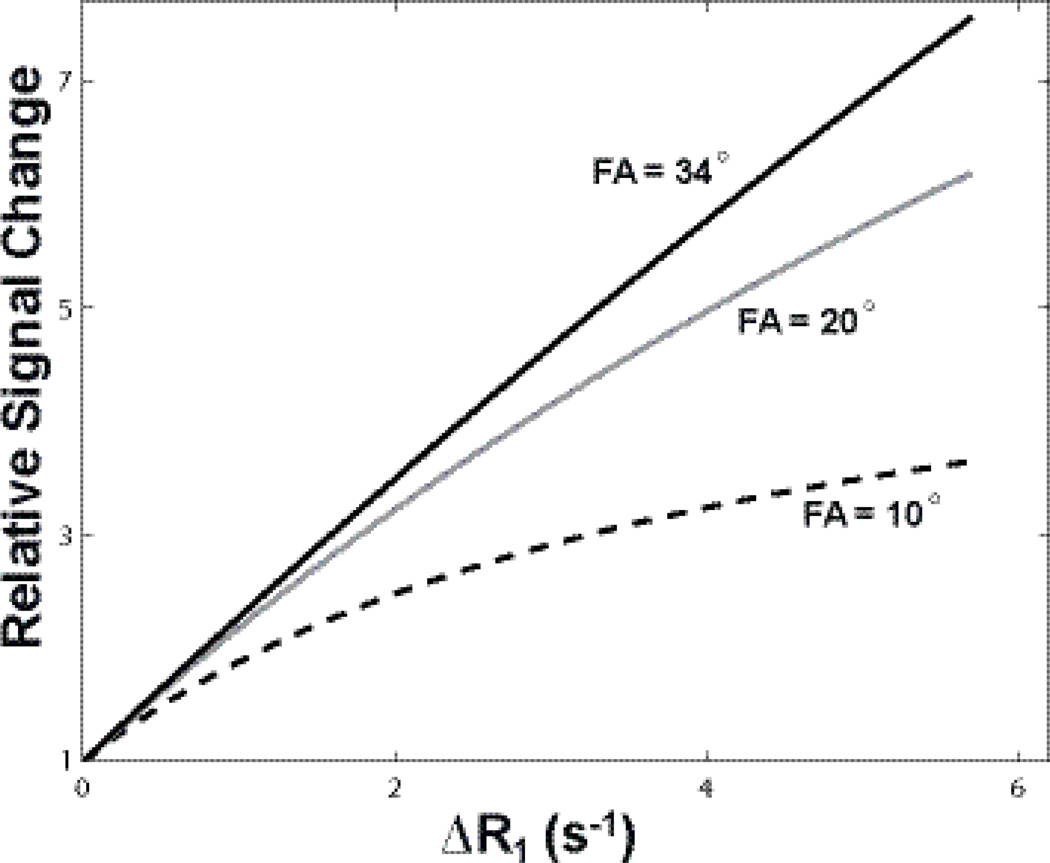
Signal change as a function of FA during a dynamic DCE-MRI scan can be best appreciated through simulations. Figure 5 shows the relative signal change (normalized to baseline) as a function of R1 difference, ΔR1. Three signal intensity curves with MRI parameters matching that of Figure 4 data were simulated using Eq. (1). A single R1 was assumed for these calculations. Though noiseless ΔR1 series was generated, the signal difference between a post-CR point and the baseline signal is largely proportional to the dynamic CNR of the point. For all calculations here, the TR value was held constant at 4.4 ms and the pre-CR R1 fixed at a literature value of 0.75 s−1 (14). With the three given FAs (10° 20°, 34°), the largest relative signal change was observed for the curve produced by 34°, the strongest T1-weighted approach. This larger relative signal change could often be interpreted as higher dynamic CNR, especially during the actual data acquisition with online imaging reconstruction. This “apparent” high CNR (numerically it may in fact be lower due to lower intrinsic SNR, see Fig. 6 for simulated signal changes at different T1 saturations) at stronger T1w can be visually appealing because of its larger dynamic imaging contrast. Figure 5 also implies that the DCE-MRI sequence with stronger T1-weighting will intrinsically have a greater dynamic range (FA =10° curve plateaus at smaller ΔR1). An additional benefit of stronger T1w also includes simplified [CR] calibration: within the experimental parameter range, the tissue R1 changes more linearly with signal intensity. However, this practical linearity is not mandatory, and the signal vs. R1 conversion can be readily determined numerically (15). On the other hand, recall that Figure 4 shows that the highest SNR is achieved with data acquired at 10°, a FA closer to Ernst angles at most pre- and post-CR time points (for TR = 4.4 ms, the expected R1 for an Ernst angle of 10° is ~ 3.5 s−1). MRI signal is expensive, and a ~ 50% SNR reduction throughout the entire CR passage may be too large a penalty to take since it is the dynamic SNR that mostly determines the pharmacokinetic parameter precision. When a DCE-MRI sequence is designed to maximize time-course SNR, however, the relationship of signal vs. [CR] (or signal vs. ΔR1) can noticeably depart from linear expression relatively quickly.
Figure 5.
Simulated relative signal change normalized to pre-CR values were plotted as a function of R1 difference, ΔR1. The three signal intensity curves were simulated using Eq. (1) assuming single compartment. The signal difference between a post-CR point and the baseline is proportional to the “apparent” dynamic CNR of the point. With the three given FAs, the largest relative signal change is observed for the curve produced by the largest FA, 34°, the strongest T1-weighted approach. Larger relative signal change produced by heavy T1-weighting (e.g., 34° here) could often be interpreted as higher dynamic CNR, especially during the actual data acquisition with online imaging reconstruction. Even though the numerical CNR often shows the contrary due to poorer SNR.
Water Exchange Sensitivity Consideration
Since CR and water never distribute equally in vivo, the water exchange sensitivity of a given DCE-MRI sequence must be considered. Following details described in Methods, Figure 6 plots simulated two-site model DCE-MRI signal vs. [CR] (site CR concentration) curves for NXL and FXL conditions at two FAs, 10° and 45°. For the simulation, pre-CR longitudinal relaxation rate constant values were set to a literature value for breast fibroglandular at 3T, R10 = 0.75 s−1 (14). The [CR] relaxivity was assumed to be 3.8 [mM−1s−1] and the population fraction for the space accessible by CR was fixed at 0.2. The NXL and FXL curves largely overlap with each other at FA = 45°, representing the well-known exchange minimized approach (16). Our breast DCE-MRI experimental data could not be acquired with an FA larger than ~ 34° due to the Specific Absorption Rate (SAR) limitation. So for this experiment the 34° FA acquisition represents our closest approach to minimum exchange sensitivity. By simply reducing FA to 10°, the signal is more than doubled for the entire [CR] range. Even at relatively low [CR], the FXL and NXL curves clearly depart from each other. That is, water exchange effect will be encoded into DCE-MRI signal. For any given [CR], the difference between the FXL (dashed black) and NXL (red) defines specific water exchange sensitivity with the pulse sequence. Besides pulse sequence parameters, actual water exchange information encoded into the DCE data will depend on CR extravasation rate, water exchange rate, and site population fraction. T2* effects will also affect exchange sensitivity (17). This discussion, however, is beyond the scope of this paper.
We demonstrate the water exchange effect for the two breast DCE-MRI data sets acquired at FAs of 10° and 20° in Figure 7 with simulations based on real ROI data. Because of IRB protocol and logistic reasons, intra-subject DCE-MRI measurements with different pulse sequence parameters are not feasible at the time. Thus, in order to avoid the effects of inherent difference in CR extravasation between the two lesions, data were extracted from variable ROIs in each study (with different FA) to construct a representative ROI data for each lesion so that they produced similar pharmacokinetic parameter values with the FXL model. Here, the ROI Ktrans values for FAs of 10° and 20° are 0.0698 min−1 and 0.0687 min−1respectively; and ve values are 0.176 and 0.184, respectively. Due to severe subject motion from one subject toward the last minute of the DCE-MRI data acquisition, the last three time points from both ROI data were excluded from data fitting. Four hundred rounds of simulations were then carried out for each ROI data set with random Gaussian noise directly added to the data points during each simulation round, so SNRmulti of the simulated time-course is comparable to that of a single pixel. The FXR-a returned Ktrans values (mean±SD) from the simulations for the 10° and 20° are 0.11±0.0076 min−1 and 0.092±0.0069 min−1respectively. Those for ve are 0.64±0.028 and 0.37±0.034, respectively, and those for τi are 0.77±0.04 s and 0.40±0.06 s, respectively. Fig. 7a plots representative simulated ROI data and fitting results. Filled symbols (circles: 10°, squares: 20°) in Fig. 7a trace the time-course data points. The solid curves are for FXR-a and the dashed curves are for FXL fittings, respectively. The apparent relative enhancement difference (max. relative signal change for 10° is ~ 95% and that for 20° is ~ 135%) is largely due to the different flip angles used in data acquisition. The fact that the dashed and solid curves do not overlap in both cases indicate that detectable water exchange effects are present in these data. One illustration of DCE data sensitivity to water exchange can be appreciated from Fig. 6. Using 10° as an example, FXL and NXL curves depart each other at a low compartmental [CR] ~ 0.3 mM. When Ktrans is greater than 0.05 min−1[CR] in extravascular, extracellular space (EES) is transiently sufficiently high to impart water exchange effects into DCE time-course. This FXL and NXL departure occurs at higher [CR] with increasing FA. Fig. 7b summarizes Ktrans results with squares showing the mean Ktrans values and the bar lengths representing the SD. Ktrans increases from FXL to FXR-a as expected (8). The two time-courses that had similar FXL Ktrans values returned very different FXR-a Ktrans values when water exchange effects are considered. Lesions 1 (with FA = 10° data acquisition) and 2 (with FA = 20° data acquisition) were a malignant invasive ductal carcinoma and a benign lesion with atypical ductal hyperplasia, respectively, revealed by pathology analyses of surgical biopsy specimens. The findings of larger ΔKtrans (= Ktrans(FXR-a) – Ktrans(FXL)) for the malignant lesion compared to the benign lesion are consistent with those previously reported (9, 11). The fact that similar error bars were observed for the two cases suggests that DCE-MRI data acquired with 10° and 20° FAs are both sensitive to water exchange effects. However, the FXR-a fitting error bar was substantially larger for the data acquired with FA = 34° (data not shown), implying that it is not appropriate to fit data insensitive to the exchange effects using a pharmacokinetic model accounting for water exchange.
Water exchange effect on DCE-MRI pharmacokinetic parameters may also be dependent on prominent tissue τi values. Under similar CR extravasation rate, tissue regions with larger τi values will depart FXL first at lower [CR]. Recent results (18) show a potential τi zone difference in the prostate. Figure 8a shows a post-CR DCE image of the prostate from one subject with malignant foci found in the left peripheral zone (image right) during subsequently performed ten-core biopsy. Malignancy was found in all five specimens from the left peripheral zone. No malignancy was found from the five specimens of the right side. Based on this information and the T2* MRI, the suspicious lesion area was identified by a radiologist. The prostate is indicated in the yellow ROI (Fig. 8a). Zoomed τi and Ktrans(FXL) color maps for the ROI in a are shown in panels b and crespectively. Though Ktrans (FXL) values from the central zone are high, comparable to the elevated lesion Ktrans hot spot on the right side of the image, the τi values are much lower in the central zone. This implies that it requires a much higher [CR] to drive the exchange system out of FXL for the central zone. The ΔKtrans map measuring the Ktrans difference between FXR-a (not shown) and FXL is shown in d. Most Ktrans(FXL) hot spots in the central zone area in panel c are now approaching zero ΔKtrans values and appear as cold spots in panel d. In contrast, the suspicious lesion area displays a hot spot on the right side of the ΔKtrans image.
Discussion
DCE-MRI provides a relatively easy and powerful method to capture tissue CR uptake by signal change following CR injection. To more reliably interpret the DCE-MRI time-course, it is important to optimize DCE-MRI protocol that balances data acquisition considerations as well as pharmacokinetic implications.
For a given data acquisition time, DCE-MRI sequence optimized for SNR is highly desired. Not only because the gained SNR can be used for spatiotemporal resolution or tissue coverage improvement, higher SNR also improves the precision of pharmacokinetic model parameters extracted. Except for pulse sequences like SWIFT that has effectively zero TE (19), common FLASH sequence that uses extremely short TE inevitably increases receiver bandwidth that also introduces extra noise that negatively impacts SNR. However, as pointed out by Macovski (20), we appreciate that our use of SNR comparisons are inherently biased, and that SNR can be recovered by maintaining signal integration time across BW, for example by collecting another echo when BW is doubled. Our data show that with existing hardware, minimum TE corresponding to a pixel BW of ~ 400 Hz/pix could provide good SNR and CNR.
One challenge for DCE-MRI with FLASH sequence is that there is no single optimal FA for the dynamic time-course. Due to changing R1, the Ernst angle at each time point during CR passage varies and the effect of CR extravasation on voxel time-course R1 is often unknown beforehand. In fact, the latter is precisely what needs to be quantified. At fixed TR, a FA close to both pre- and most post-CR expected Ernst angles is expected to produce good SNR. With TR (e.g., 4.4 ms in this study) of several milliseconds commonly used for 3D FLASH, pre-CR Ernst angle is often below 5°. This implies that the FA for the DCE-MRI sequence should be relatively small and usually below 20°. Our data support previous work proposing FA to be at least double that of pre-CR Ernst angle (15). Using TR/FA of 4.4 ms/10° for breast imaging as an example, 10° is closer to double that of pre-CR Ernst angle. In fact, 10° is optimized for R1 ~ 3.5 s−1or a ΔR1 change of greater than 2.5 s−1. This ΔR1 range is sufficient to cover R1 values following CR injection in most tissues, lesions, and even blood. A 10° FA has the capability of measuring 0.0 s−1 < ΔR1 < 40 s−1sufficient for almost all tissues, lesions, and even blood R1 dynamic range values following single dose CR injection.
It is important to notice that a DCE-MRI sequence optimized for SNR automatically has water exchange sensitivity built in. The NXL and FXL “calibration” curves (Fig. 6) depart from each other reflects this point. Tumor DCE-MRI data acquired with optimized SNR (or an acquisition far away from exchange minimized approach) present more challenge for FXL modeling as both R1 vs. [CR] as well as signal vs. [CR] depart from linear relationship at lower [CR].
Modeling DCE-MRI with FXR-a has the benefit of extracting τi which quantifies water intracellular lifetime. τi complements Ktrans measures that define CR transfer rate constant across the blood vessel. From data analysis point of view, FXR-a with one extra free parameter will ‘soften’ other fitted parameters when compared to FXL. The larger SDs from FXR-a (compared to FXL) in Figure 7b clearly reflect this for Ktrans. It is also worth noting that if SNR is reduced due to DCE-MRI acquisition priority tradeoffs, it will negatively impact FXR-a fittings. Practically, this means if SNR is below a certain level, it becomes more challenging to use the more complicated model.
DCE-MRI data acquired with exchange-sensitivity-minimized approach (large FA, short TR) accepts a large SNR penalty compared to the exchange-sensitivity-optimized approach. The extra RF power required for exchange-minimized approach will also limit its imaging capability for coverage and resolution, especially at high B0. Equally as important, when DCE-MRI data are acquired with a TR/FA combination closer to exchange-minimized approach, pharmacokinetic modeling with the exchange sensitized approach becomes difficult (21) as the implied calibration curves (Fig. 6 bottom lines) overlap and the exchange sensitivity diminishes.
Though commonly not considered, T2* effect may become noticeable in DCE-MRI, especially at high magnetic field. So far, proportional (global) T2* effect is covered in literature (22, 23). However, disproportionate T2* signal quenching is highly likely.
Though most topics discussed here are generic to DCE-MRI, there are a few limitations in current work: 1) The SNRstdv definition used for bandwidth and minimum TE evaluations in this study carries some potential bias as parallel imaging (iPAT = 2) was used to save imaging time. So it can be different from “true” SNR (6, 24) due to noise distribution (non-independence of noise from different receiver channels). These SNRstdv values should be treated as relative. However, the findings from these data should reflect the relative behavior trends. Interested readers should refer to existing literature for details on SNR (6, 24–26); 2) A constant FA value is taken as prescribed for each pulse sequence and no B1 mapping was performed for flip angle correction. Our data indicate the excitation pulse of standard 3D FLASH sequence from Siemens TIM TRIO with body coil excite can achieve near prescribed FA for more than half of the slices around the center of the slab. All our slices of interest are within the center 50% of their associated 3D slabs, thus no further B1 correction was pursued. It is worth noting that actual FA of B1 will increasely differ from the targeted FA value moving away from the 3D slab center, and B1 calibration becomes increasely important; 3) All experimental data were acquired from a Siemens scanner, so vendor specific issues were not directly addressed; 4) Intra-subject data for breast DCE-MRI at different FAs are not available, so a direct comparison of the effect of pulse sequence details on pharmacokinetic parameters cannot be accomplished; 5) FXR-a model inherently assumes that all DCE-MRI signals are from the apparent compartment that has a longer apparent relaxation time constant. The validity of this assumption requires further investigation.
Conclusion
DCE-MRI acquisition with a FA about double that of pre-CR Ernst angle can provide much better SNR compared to high FA (e.g., > 6·FAErnst) exchange-minimized approach and still maintain a reasonable dynamic range to cover both tissue and blood signal changes after a single dose CR injection. When SNR is optimized in this way, DCE time-course data are often sensitivity to water exchange effects. SNR has a very important influence on DCE-MRI pharmacokinetic modeling with increased parameter precision strongly associated with SNR. Intrinsically, DCE-MRI works as a dual probe for CR and water: τi measures water exchange across cell membrane and compliment to Ktrans that measures CR transfer rate across blood vessel. As expected, simpler model is less demanding on time-course SNR but often can not fit the data.
ACKNOWLEDGEMENTS
The authors thank Drs. Karen Oh and Alina Tudorica for breast subject enrollment, Drs. Mark G. Garzotto, Tomasz M. Beer, and Ryan A. Priest for prostate subject enrollment, Dr. Charles Springer for many insightful discussions, and Mr. William Woodward for assistance in DCE-MRI data acquisitions.
Grant Support: Medical Research Foundation of Oregon (XL), NIH: R01-CA120861 (WH), U01-CA154602 (WH), R01-NS40801 (WDR), and 3UL1RR024140-04S1.
Footnotes
Publisher's Disclaimer: This is a PDF file of an unedited manuscript that has been accepted for publication. As a service to our customers we are providing this early version of the manuscript. The manuscript will undergo copyediting, typesetting, and review of the resulting proof before it is published in its final citable form. Please note that during the production process errors may be discovered which could affect the content, and all legal disclaimers that apply to the journal pertain.
References
- 1.Sodickson DK, Manning WJ. Simultaneous acquisition of spatial harmonics (SMASH): fast imaging with radiofrequency coil arrays. Magn Reson Med. 1997;38(4):591–603. doi: 10.1002/mrm.1910380414. [DOI] [PubMed] [Google Scholar]
- 2.Pruessmann KP, Weiger M, Scheidegger MB, Boesiger P. SENSE: sensitivity encoding for fast MRI. Magn Reson Med. 1999;42(5):952–962. [PubMed] [Google Scholar]
- 3.Griswold MA, Jakob PM, Heidemann RM, Nittka M, Jellus V, Wang J, Kiefer B, Haase A. Generalized autocalibrating partially parallel acquisitions (GRAPPA) Magn Reson Med. 2002;47(6):1202–1210. doi: 10.1002/mrm.10171. [DOI] [PubMed] [Google Scholar]
- 4.Laub G, Kroeker R. Syngo TWIST for Dynamic Time-Resolved MR Angiography. Magnetom Flash. 2006;3:93. [Google Scholar]
- 5.Lustig M, Donoho D, Pauly JM. Sparse MRI: The application of compressed sensing for rapid MR imaging. Magn Reson Med. 2007;58(6):1182–1195. doi: 10.1002/mrm.21391. [DOI] [PubMed] [Google Scholar]
- 6.Dietrich O, Raya JG, Reeder SB, Reiser MF, Schoenberg SO. Measurement of signal-to-noise ratios in MR images: influence of multichannel coils, parallel imaging, and reconstruction filters. J Magn Reson Imaging. 2007;26(2):375–385. doi: 10.1002/jmri.20969. [DOI] [PubMed] [Google Scholar]
- 7.Tofts PS, Brix G, Buckley DL, Evelhoch JL, Henderson E, Knopp MV, Larsson HB, Lee TY, Mayr NA, Parker GJ, Port RE, Taylor J, Weisskoff RM. Estimating kinetic parameters from dynamic contrast-enhanced T(1)-weighted MRI of a diffusable tracer: standardized quantities and symbols. J Magn Reson Imaging. 1999;10(3):223–232. doi: 10.1002/(sici)1522-2586(199909)10:3<223::aid-jmri2>3.0.co;2-s. [DOI] [PubMed] [Google Scholar]
- 8.Yankeelov TE, Rooney WD, Li X, Springer CS. Variation of the relaxographic "shutter-speed" for transcytolemmal water exchange affects the CR bolus-tracking curve shape. Magn Reson Med. 2003;50(6):1151–1169. doi: 10.1002/mrm.10624. [DOI] [PubMed] [Google Scholar]
- 9.Huang W, Tudorica LA, Li X, Thakur SB, Chen Y, Morris EA, Tagge IJ, Korenblit ME, Rooney WD, Koutcher JA, Springer CS., Jr Discrimination of benign and malignant breast lesions by using shutter-speed dynamic contrast-enhanced MR imaging. Radiology. 2011;261(2):394–403. doi: 10.1148/radiol.11102413. [DOI] [PMC free article] [PubMed] [Google Scholar]
- 10.Li X, Huang W, Morris EA, Tudorica LA, Seshan VE, Rooney WD, Tagge I, Wang Y, Xu J, Springer CS. Dynamic NMR effects in breast cancer dynamic-contrast-enhanced MRI. Proceedings of the National Academy of Sciences of the United States of America. 2008;105(46):17937–17942. doi: 10.1073/pnas.0804224105. [DOI] [PMC free article] [PubMed] [Google Scholar]
- 11.Huang W, Li X, Morris EA, Tudorica LA, Seshan VE, Rooney WD, Tagge I, Wang Y, Xu J, Springer CS. The magnetic resonance shutter speed discriminates vascular properties of malignant and benign breast tumors in vivo. Proceedings of the National Academy of Sciences of the United States of America. 2008;105(46):17943–17948. doi: 10.1073/pnas.0711226105. [DOI] [PMC free article] [PubMed] [Google Scholar]
- 12.Roemer PB, Edelstein WA, Hayes CE, Souza SP, Mueller OM. The NMR phased array. Magn Reson Med. 1990;16(2):192–225. doi: 10.1002/mrm.1910160203. [DOI] [PubMed] [Google Scholar]
- 13.Constantinides CD, Atalar E, McVeigh ER. Signal-to-noise measurements in magnitude images from NMR phased arrays. Magn Reson Med. 1997;38(5):852–857. doi: 10.1002/mrm.1910380524. (Erratum in: Magn Reson Med 2004; 2052:2219). [DOI] [PMC free article] [PubMed] [Google Scholar]
- 14.Rakow-Penner R, Daniel B, Yu H, Sawyer-Glover A, Glover GH. Relaxation times of breast tissue at 1.5T and 3T measured using IDEAL. J Magn Reson Imaging. 2006;23(1):87–91. doi: 10.1002/jmri.20469. [DOI] [PubMed] [Google Scholar]
- 15.Schabel MC, Parker DL. Uncertainty and bias in contrast concentration measurements using spoiled gradient echo pulse sequences. Phys Med Biol. 2008;53(9):2345–2373. doi: 10.1088/0031-9155/53/9/010. [DOI] [PMC free article] [PubMed] [Google Scholar]
- 16.Donahue KM, Weisskoff RM, Chesler DA, Kwong KK, Bogdanov AA, Jr, Mandeville JB, Rosen BR. Improving MR quantification of regional blood volume with intravascular T1 contrast agents: accuracy, precision, and water exchange. Magn Reson Med. 1996;36(6):858–867. doi: 10.1002/mrm.1910360608. [DOI] [PubMed] [Google Scholar]
- 17.Li X, Priest RA, Siddiqui F, Beer TM, Garzotto MG, Woodward WJ, Rooney WD, Springer CS. Book of abstracts: Seventeenth Annual Meeting of International Society for Magnetic Resonance in Medicine. Honolulu, USA: ISMRM; 2009. Systematic DCE-MRI Parameter Errors Caused by Disproportionate Transverse Relaxation (T2*) Quenching of Tissue Compartmental Water Proton Signals; p. 4221. [Google Scholar]
- 18.Li X, Priest RA, Woodward WJ, Tagge IJ, Siddiqui F, Beer TM, Garzotto MG, Huang W, Rooney WD, Springer CS. Book of abstracts: Nineteenth Annual Meeting of International Society for Magnetic Resonance in Medicine. Montreal, Quebec, Canada: ISMRM; 2011. Implications of Mean Intracellular Water Lifetime for Prostate DCEMRI Modeling; p. 3115. [Google Scholar]
- 19.Idiyatullin D, Corum C, Park JY, Garwood M. Fast and quiet MRI using a swept radiofrequency. J Magn Reson. 2006;181(2):342–349. doi: 10.1016/j.jmr.2006.05.014. [DOI] [PubMed] [Google Scholar]
- 20.Macovski A. Noise in MRI. Magn Reson Med. 1996;36(3):494–497. doi: 10.1002/mrm.1910360327. [DOI] [PubMed] [Google Scholar]
- 21.Buckley DL, Kershaw LE, Stanisz GJ. Cellular-interstitial water exchange and its effect on the determination of contrast agent concentration in vivo: dynamic contrast-enhanced MRI of human internal obturator muscle. Magn Reson Med. 2008;60(5):1011–1019. doi: 10.1002/mrm.21748. [DOI] [PubMed] [Google Scholar]
- 22.de Bazelaire C, Rofsky NM, Duhamel G, Zhang J, Michaelson MD, George D, Alsop DC. Combined T2* and T1 measurements for improved perfusion and permeability studies in high field using dynamic contrast enhancement. European radiology. 2006;16(9):2083–2091. doi: 10.1007/s00330-006-0198-1. [DOI] [PubMed] [Google Scholar]
- 23.Ludemann L, Prochnow D, Rohlfing T, Franiel T, Warmuth C, Taupitz M, Rehbein H, Beyersdorff D. Simultaneous Quantification of Perfusion and Permeability in the Prostate Using Dynamic Contrast-Enhanced Magnetic Resonance Imaging with an Inversion-Prepared Dual-Contrast Sequence. Annals of biomedical engineering. 2009 doi: 10.1007/s10439-009-9645-x. [DOI] [PubMed] [Google Scholar]
- 24.Goerner FL, Clarke GD. Measuring signal-to-noise ratio in partially parallel imaging MRI. Med Phys. 38(9):5049–5057. doi: 10.1118/1.3618730. [DOI] [PMC free article] [PubMed] [Google Scholar]
- 25.Edelstein WA, Bottomley PA, Pfeifer LM. A signal-to-noise calibration procedure for NMR imaging systems. Med Phys. 1984;11(2):180–185. doi: 10.1118/1.595484. [DOI] [PubMed] [Google Scholar]
- 26.Henkelman RM. Measurement of signal intensities in the presence of noise in MR images. Med Phys. 1985;12(2):232–233. doi: 10.1118/1.595711. [DOI] [PubMed] [Google Scholar]


