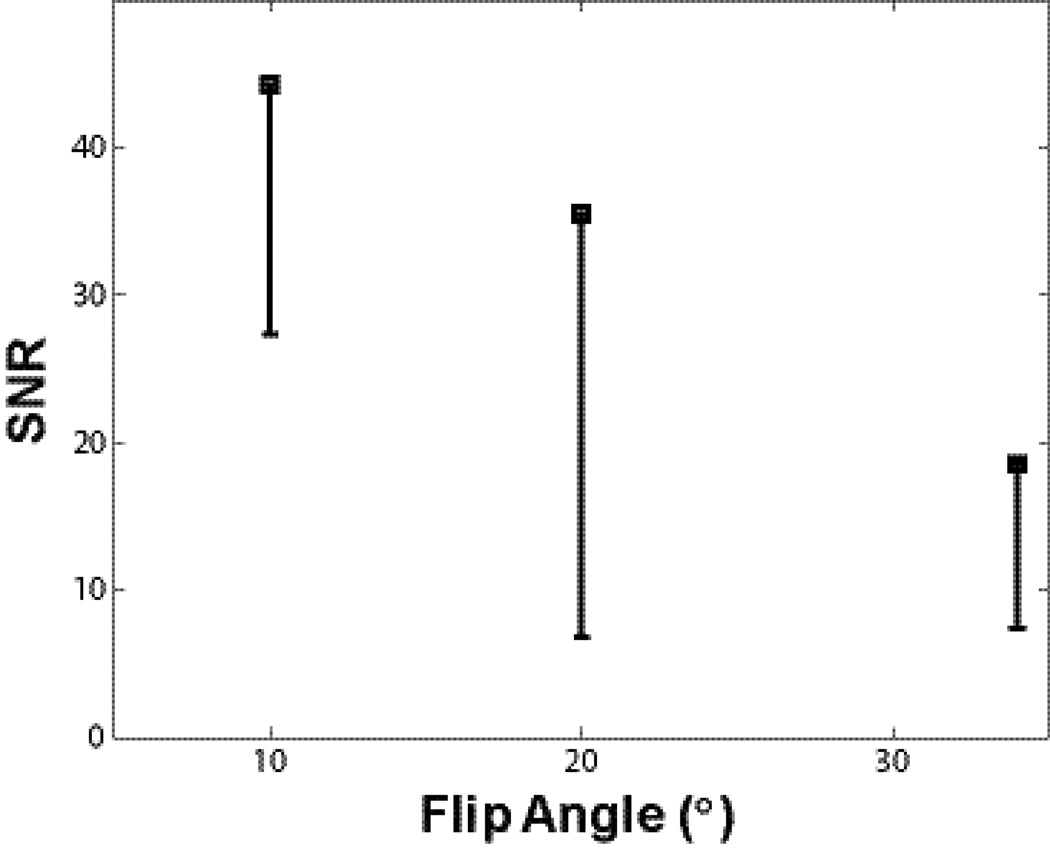
Figure 4.
SNRmulti from baseline DCE-MRI data are plotted against FA. Black squares indicate average pre-CR SNR at three different FAs from three equal-sized ROIs matching the smallest lesion. One standard deviation of pixel SNRmulti values within each ROI is plotted as the black error bars. Error bar length for the second subject (FA= 20°) is noticeable larger - due to its smallest lesion size and thus most prone to partial volume effect. A noticeable SNR decrease with increasing FA is seen.

