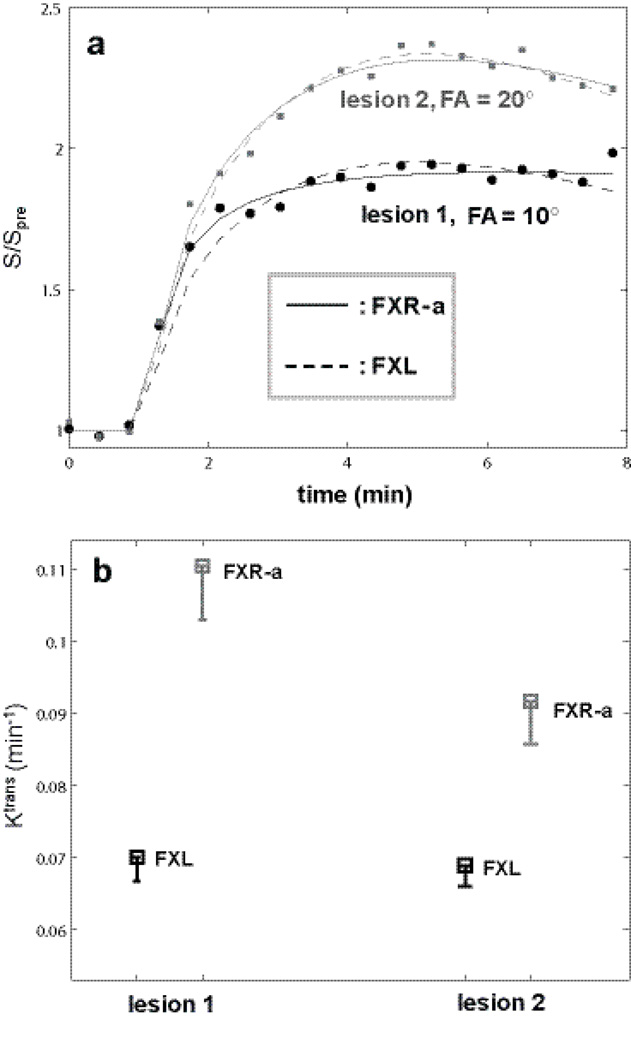
Figure 7.
Lesion ROI DCE time-course data were constructed for the two breast lesions with FAs of 10° and 20°, respectively, so that the FXL fitted results for both time courses returned similar parameter values. Four hundred simulation rounds were then carried out for each ROI time-course with random Gaussian noise directly added to the ROI data points. Panel a plots representative simulated ROI data and fitting results. Filled symbols (circles: lesion 1, 10° FA, squares: lesion 2, 20° FA) represent the time-course data points. The solid curves are fittings from FXR-a modeling and the dashed curves from FXL modeling. The apparent different relative enhancement (max. relative signal change for 10° is 95% and that for 20° is 135%) is largely due to the different flip angles used in data acquisition. The fact that the dashed and solid curves not overlap each other in both cases indicates that there are detectable water exchange effects in these data. Panel b summarizes Ktrans results with squares showing the mean Ktrans values and the bar length representing the standard deviation.

