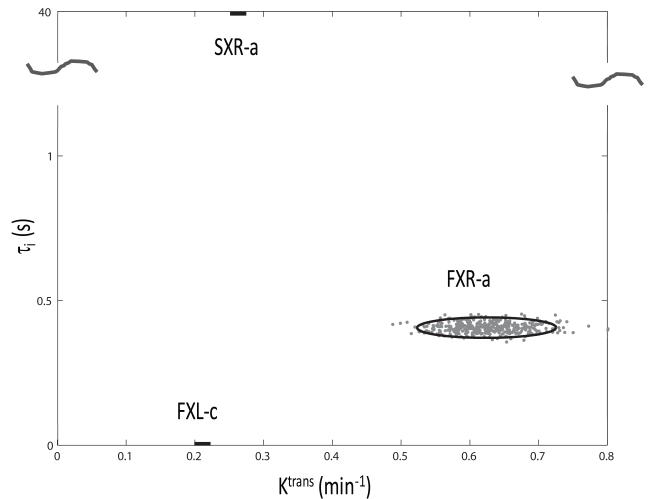
Figure 4.
The 2D τi/Ktrans parameter space for three different modelings of the Fig. 1d suspicious ROI points. Each oval (two are 1D) has radii equal to 2SD of the parameter values returned from 400 Monte Carlo fittings with starting magnitudes randomly distributed over the entire plot. [The fitting points (gray) are shown for the FXR-a analysis.] The three models are labeled: the SM(FXL-c) approach [Eqs. (1)-(4), τb = τi → 0]; the SSM(FXR-a) approach [Eq. (5), ] fittings; and the SSM(SXR-a) approach [Eqs. (5) - (7), ]. The FXL-c and SXR-a ovals are one dimensional. In the former, the τi value is constrained to be effectively zero. In the latter, the τi values returned are all pegged at the upper bound, 40 s, of the SSM(SXR-a) τi iteration (note the ordinate scale break). Neither of these τi values is realistic. In contrast, the mean τi value returned by FXR-a is 0.41 (± 0.02) s, which is quite reasonable.

