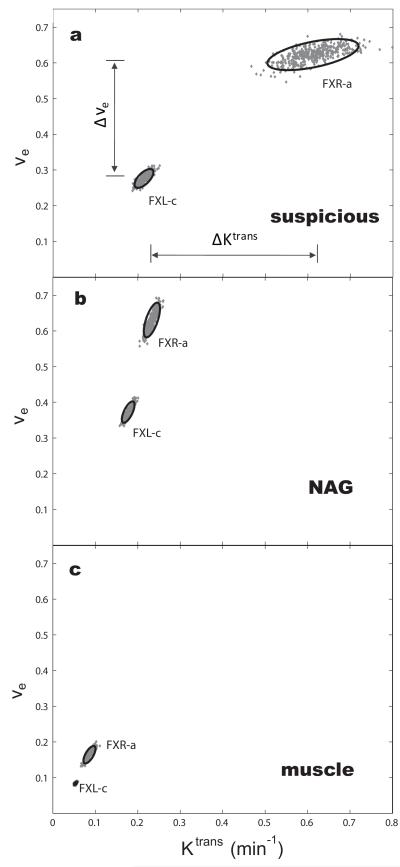
Figure 5.
The 2D ve/Ktrans parameter spaces showing 400 Monte Carlo SSM(FXR-a) [Eq. (5), ] fittings (points) and SM(FXL-c) [Eqs. (1)-(4), τb = τi → 0] fittings (points) of the three Fig. 1d-f time-course points: suspicious (a), NAG (b), and muscle (c). The Δ biomarkers, Δve and ΔKtrans, are defined in panel a. It is seen that ΔKtrans is significantly large for only the suspicious ROI: malignancy was subsequently found on the same side of the prostate as this ROI.

