
Figure 3.
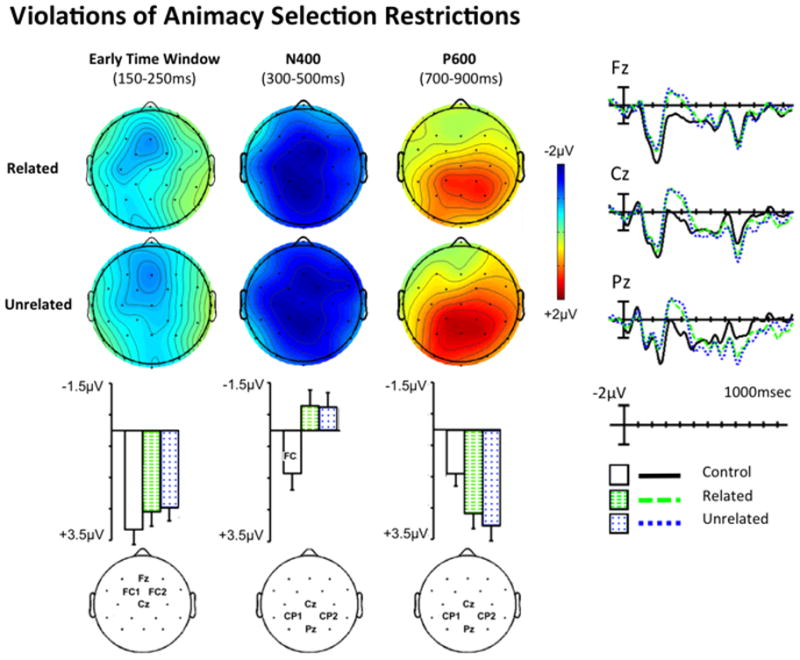
ERPs evoked by critical nouns in Control, semantically Related and Unrelated Animacy Selection Restriction Violation sentences along midline electrode sites, as well as voltage maps in the 150–250ms, N400 (300–500ms) and P600 (700–900ms) time windows. Solid black lines and white bars indicate Control condition; dashed green line and bar indicate Related Animacy Selection restriction Violation condition; dotted blue line and bar indicate Unrelated Animacy Selection restriction Violation. The plots are shown using a -100-0ms pre-stimulus baseline. All voltage maps show differences between ERPs to the violations and control critical words, averaged across each time window. Bar graphs show the amplitude of ERPs to each condition averaged across each time window, across the four electrode sites where the effects were maximal (indicated below each bar graph). Error bars show standard errors.